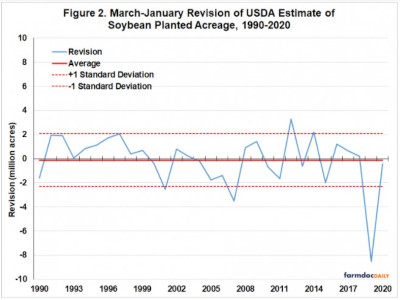

The fact that revisions for corn and soybean planted acreage are unbiased does not necessarily imply that the frequency of positive and negative revisions is perfectly balanced. For example, 42 percent of corn acreage revisions are positive and 58 percent are negative. Exactly the opposite is true for soybean acreage revisions. Even though frequencies are not necessarily 50/50, revisions can still be unbiased on average because the average size of positive and negative deviations differ.
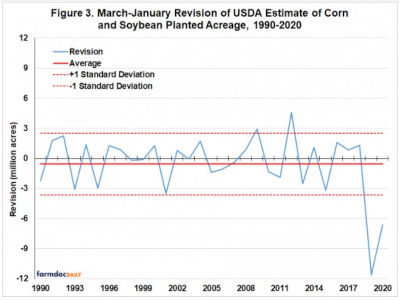
In order to get a sense of the volatility of acreage revisions over time, Figures 1-3 include plus/minus one standard deviation bands around the average. Since the standard deviation of revisions is similar for the two crops (1.8 million acres for corn and 2.2 million acres for soybeans), the one standard deviation bands are quite similar. In both cases, the bands are roughly plus/minus two million acres around zero.
The band for combined corn and soybean acreage is roughly plus/minus three million acres, which is less than the sum of the bands for the individual crops. This occurs because the acreage revisions for corn and soybeans have a tendency to partially offset one another in a given year. Finally, the bands illustrate the unusually large acreage revisions in 2019 and 2020 due to very wet spring weather and planting delays.
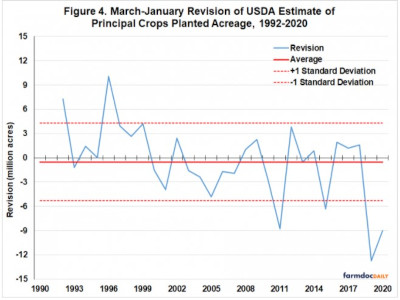
Figure 4 presents the revisions in USDA planted acreage estimates of all principal crops over 1992-2020. Principal crop acreage is the sum of acreage across a slightly changing mix over time of more than 20 crops. The USDA only began publishing principal crop acreage estimates for the Prospective Plantings report in 2017. As a result, estimates before this date are computed from data published for individual crops. This is done by applying the definition of principal crops found in the Crop Production Annual Summary for a given crop year to the acreage data found in the Prospective Plantings report for the same year. In a similar fashion, USDA did not begin publishing principal crop estimates in the Crop Production Annual Summary report until 1998. Principal crop estimates are computed for 1992-1997 based on the definition of principal crops found in the 1998 Crop Production Annual Summary report. While the computation of estimates of principal crop acreage in the above manner is fairly straightforward, it should be noted that revisions are not entirely based on official USDA totals for principal crop acres over 1992-2016.

Figure 4 indicates that the average acreage revision is again very close to zero, so it can be concluded that USDA revisions of principal crop acreage are unbiased. The one standard deviation band for principal crops acreage is roughly plus/minus five million acres, showing that total crop acreage can swing fairly substantially from the first to the final estimate.
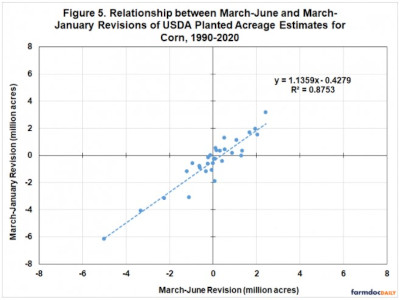
There are two remaining issues that need to be explored. The first is the question of whether there is a pattern to the revisions over time. That is, do positive revisions in one year tend to be followed by positive revisions in the following year, and vice versa? The correlation between the previous year’s revision and the current year in all cases is close to zero and statistically insignificant, which implies that the revisions are random from year-to-year. This is actually what one should expect from an efficient statistical revision process. The second issue is how much of the total revision over March-January occurs in March-June compared to June-January? This amounts to asking how much of the total acreage revision is revealed in the June Acreage report. As an example, Figure 5 shows the relationship between the March-June acreage revision for corn and the total March-January revision. The R2 for the regression is 88 percent, which shows that all but a small proportion of the total revision is revealed in the June Acreage report. The same regression for soybeans, combined corn and soybeans, and principal crops has an R2 of 77, 83, and 75 percent, respectively. It is not surprising then why the June Acreage report is considered to be such an important event by the market.

Implications
The recent USDA Prospective Plantings report indicated that U.S. farmers intended to plant 91.444 million acres of corn, 87.6 million acres of soybeans, and 316.2 million acres for principal crops, all of which were substantially smaller than expected. This article provides historical perspective to help assess the potential for these estimates to increase in future USDA reports. Our analysis of USDA revisions over 1990-2020 clearly indicates that planted acreage estimates in the Prospective Plantings report are unbiased. In other words, based solely on the history of USDA acreage revisions, the best expectation of final USDA acreage estimates at the present time are those published in the March Prospective Plantings report. This does not mean USDA planted acreage estimates will not change in future reports, only that the direction and magnitude cannot be predicted without information beyond the USDA track record of revisions. As a guide to the potential for future revisions, the likely range is roughly plus/minus two million acres for corn and soybeans, plus/minus three million acres for combined corn and soybean acreage, and plus/minus five million acres for principal crops. So, the history of USDA revisions leaves open the potential for planted acreage estimates to increase closer to what was expected before the recent Prospective Plantings report. However, that same history indicates a decrease in planted acreage estimates is about as likely as an increase.
Source : illinois.edu