On the demand side for corn, domestic demand was lowered by 150 million bushels and export demand was lowered by 100 million bushels. The reduction in corn use for ethanol represented 100 million bushels of that domestic demand reduction, going from 5.05 billion bushels to 4.95 billion bushels. The reduction this month in demand expectations, particularly in exports, is in response to the global demand outlook for U.S. corn. While global demand has been strong as a result of competitors like Brazil and Argentina struggling with dry weather, the U.S. corn crop has quickly become more attractive to global purchasers, causing the price to rise. On top of that, Argentina’s corn export restrictions and China’s desire to import more livestock feed have many turning to the U.S. to supplement their purchases, but supplies are dwindling. Something important to note is that corn export commitments are record high, but the pace of exports is slow. As of December 31, 2020, the pace of exports for the 2020/21 marketing year was 34%, with outstanding corn sales at 28.69 MMT. This is likely a factor in USDA’s reduction of corn exports; the department includes only actual sales data, not purchasing commitments.
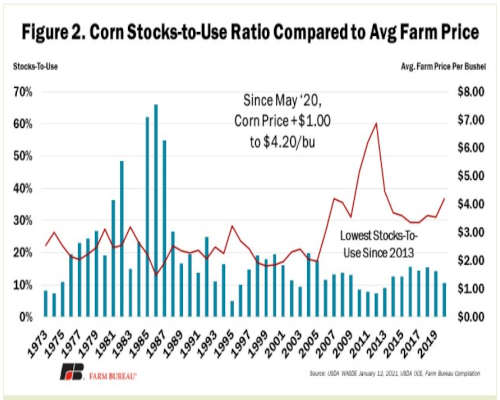
The reduction in supply and demand estimates result in an overall reduction of 150 million bushels of corn ending stocks, moving from 1.7 billion bushels to 1.5 billion bushels. Remember, this past spring, corn ending stocks for the 2020/21 crop were estimated at over 3 billion bushels (e.g., Corn Acres Should Be Reconsidered in 2020). The stocks-to-use ratio for corn is now at 10.6%, which is the lowest it has been since 2013, when the corn stocks-to-use ratio was 9.2%. With ending stocks down from last month, the price expectations for corn have increased from $4.00 per bushel to $4.20 per bushel. This is the highest corn price since 2013. Importantly, given the lengthy period during which the corn crop has gotten smaller, i.e., May 2020 to January 2021, many producers who already marketed a crop may be unable to take advantage of the recent price rally.
Figure 2 shows the historic stock-to-use ratios of corn compared to the average farm price of corn per bushel.
Soybeans
Soybean supplies did not have as large of an adjustment as corn supplies. USDA estimates total soybean supply at 4.695 billion bushels, down 14 million bushels from last month, when soybean supplies were estimated at 4.709 billion bushels. This is a result of USDA lowering yield estimates for the 2020 soybean crop from 50.7 bushels per acre to 50.2 bushels per acre.
On the demand side, soybeans got a boost in crushing and exports that helped drive up the overall demand estimates for 2020/21. Crushing rose by 5 million bushels to 2.2 billion bushels used, while exports increased by 30 million bushels to 2.23 billion bushels. The increase in soybean exports comes with the expectation that the U.S. will be the go-to alternative as competitors, like Argentina, pull back on their exports in fear of rising domestic livestock feed costs.
Click here to see more...