2015 was a very challenging year for Panhandle row crop farmers with the double whammy of low commodity prices and unfavorable weather. As a result, many farmers are uncertain as to what crops to plant for the coming year.
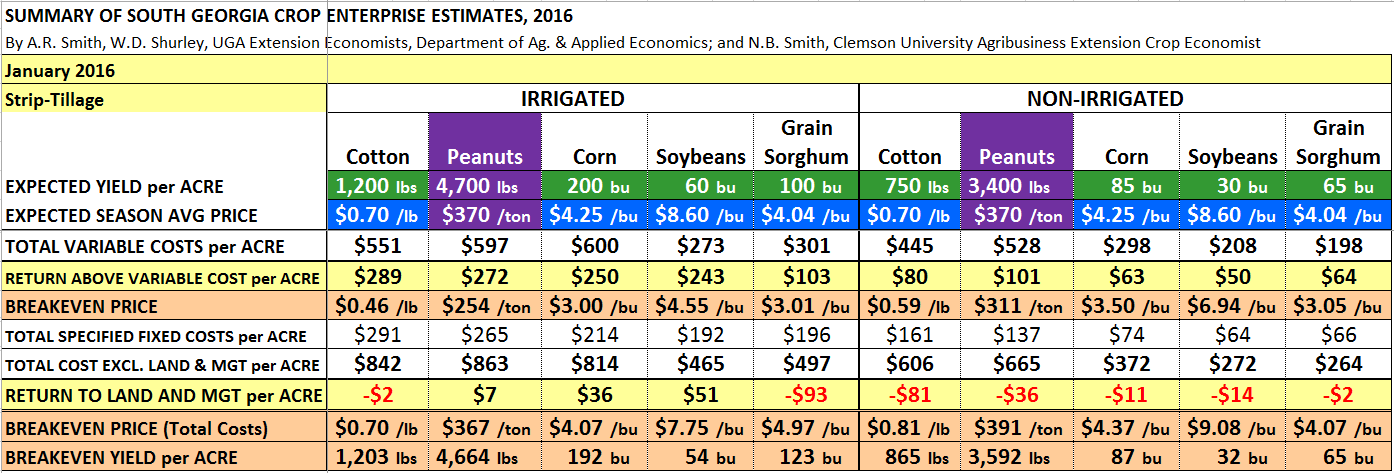
The University of Georgia has a nice tool or decision aid that provides estimated returns on investment for commonly grown crops in the southeast. The Crop Comparison Tool (CCT), which is an excel spreadsheet, comes pre-loaded with the most current estimates by UGA crop economists, but can be customized for a specific farm. These comparisons are made in both conventional and strip-till cropping systems. There is even a peanut price calculator to assist with partial production contracts to develop an overall average peanut price for true comparisons. The example below is the summary from the strip-tillage crop comparison chart. Use your mouse or touch screen to enlarge for a full screen view for easier reading.
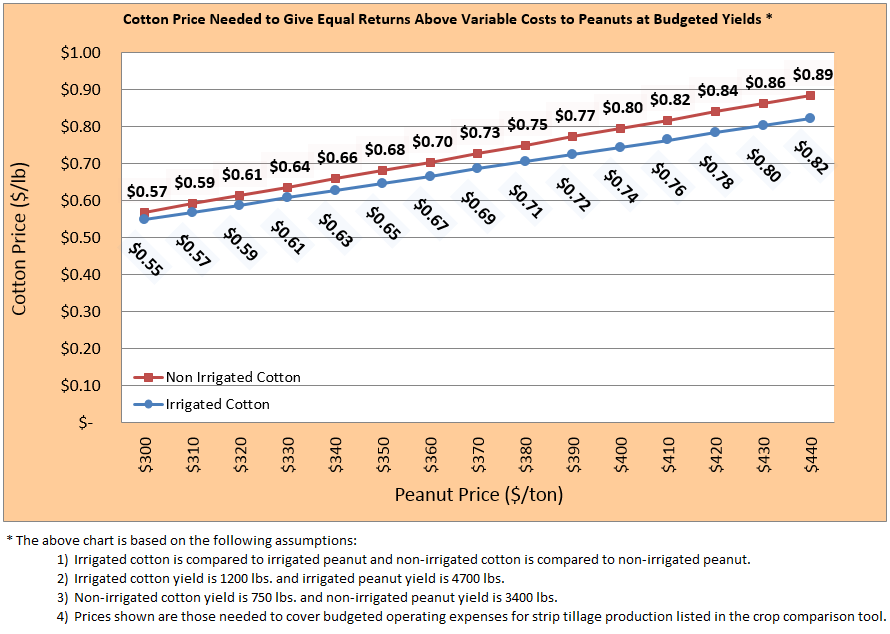
This tool also offers some charts that allow you to compare two crops and the price at which they provide equal returns. In this example you can see that a contract for cotton would need to be $0.73 per pound for dryland cotton and $0.69/lb. for irrigated cotton to be equal to a peanut contract of $370 per ton. These prices are based on some assumptions for comparisons sake. The Crop Comparison Tool has other crop combinations and can be adjusted based on the figures entered into the spreadsheet.