Agriculture has been impacted by a series of historic events related to three major developments in each of the last three years that altered trade relationships and exports, disrupted production and distribution of agriculture commodities, influenced market prices and farm income, and shaped policy perceptions. Though each of these disruptions to United State agriculture can individually be likened to other historic events, it is the series of overlapping, distinct, and significant disruptive events that is rare, with few other comparable historical sequences.
In 2018, the United States imposed tariffs on imports of steel and aluminum from almost all nations in effort to protect domestic industries. Near the same time the U.S. also imposed tariffs on select Chinese products as a response to Chinese intellectual property rights and technology policies. These separate, but coinciding, sets of tariffs led to a battle between the U.S. and many other nations, including China, who retaliated with tariffs on U.S. agricultural products. When those nations imposed the tariffs, U.S. agricultural products became more expensive in the world market and U.S. agricultural exports declined. Leading up to 2018, China was U.S. farmers’ single largest soybean customer, purchasing more than half of U.S. soybean exports leaving soybeans as one of the most vulnerable agriculture products. Aside from the tariff impact on price, the dramatic reduction in the Chinese swine herd due to African Swine Fever reduced China’s need for soybeans. See farmdoc daily articles from July 31, 2018, April 11, 2019 and April 25, 2019 for more on tariffs and trade relations.
In 2019, widespread crop producing regions of the United States experienced excess rainfall and flooding. As a result, the nation experienced record acres prevented from planting and delays that led to planting outside the optimal time frame for crop productivity. Many acres impacted were intended for corn and soybeans leading to production concerns for both crops, though corn tends to be more sensitive to late planting. See farmdoc daily articles from May 7, 2019, May 14, 2019, May 21, 2019, May 29, 2019, June 2, 2019, June 4, 2019, August 15, 2019, and December 30, 2019 for more on delayed and prevent plant.
In 2020, the global coronavirus pandemic and the control measures put in place as a response impacted agriculture supply chains and the markets for agriculture crops. The pandemic further depressed already stagnant market demand for corn and soybeans. The situation extended pressures on prices of both commodities that had existed since 2013 and had been driven down further as trade disputes became evident in 2018. For more on the impact of coronavirus on Midwest row-crop agriculture see Schnitkey, et al. 2021.
Corn and Soybean Price Timeline
Following is a narrative of related disruptive events from 2018 through 2020 and impact on agricultural exports and corn and soybean prices from the perspective of the United States. This is also illustrated in the timeline shown in Figure 1.
A significant event with implications for agriculture was the early March 2018 announcement that the U.S. would impose a 25% tariff on imported steel and 10% tariff on imported aluminum; these tariffs were in effect by the end of March. Though particularly targeted at China, the tariffs applied to all countries with the exceptions of the EU, Canada, and Mexico (farmdoc daily April 18, 2018). The U.S. also announced the first of a series of China-specific tariffs in April. These tariff announcements launched a series of tit-for-tat responses between the U.S. and China that lasted most of the year and strained trade of U.S. agricultural products with China.
Though agricultural exports to China declined throughout the first half of 2018, the movement was generally consistent with the normal seasonal pattern for this part of the year as illustrated in the first panel of Figure 2. Throughout the first half of 2018, total U.S. agricultural exports also declined but remained above 2017 and the prior five- year average (Figure 3). Corn and soybean prices remained fairly stable over the three-month period of March through May 2018 as reactions in the export markets were yet to be realized. Corn fluctuated up and down over a 10% price range and soybeans over an 8% price range.
A significant drop in price of the two commodities is evident beginning in early June 2018 after the U.S. extended tariffs on imported steel and aluminum to the ally trading nations previously excluded. And in early July the U.S. and China both imposed the tariffs each had threatened for months, notably signifying the reality of the situation. From the beginning of June 2018 to the middle of July at the first trough point, corn prices dropped 19% and soybean prices dropped 25%. During this time U.S. agricultural exports to China continued to drop, at a time when the normal seasonal pattern started to increase (Figure 2)
Though still higher than the prior year and five-year average, total U.S. agricultural exports began falling quickly during the summer months of 2018, a period when a plateau in exports is normal (Figure 3). A low point was reached in September, when total U.S. agricultural export value was at the norm for the month.
The U.S. reached an informal trade agreement with Canada and Mexico on September 30, 2018. The new agreement, United States Mexico Canada Agreement (USMCA), was an update to the 1990s North American Free Trade Agreement (NAFTA) between the three nations. With positive momentum for an updated agreement and a flux of supply during U.S. harvest, U.S. agricultural exports increased in the last quarter of 2018, though staying $1 billion to $2 billion below normal season export levels. The difference can be attributed to the absence of China’s normal purchase levels with a partial offset in increased purchases of U.S. agricultural products by other countries. Over the last quarter of 2018 corn and soybean prices inched higher, though still lower than before considerable June price drop.
Despite a temporary trade truce between the U.S. and China in late November 2018 and China’s first resumed purchase of U.S. soybeans in December, corn and soybean prices remained depressed throughout the 2018-19 winter and spring months. Though U.S. ag exports to China began to improve in that time, export value was well below the norm of previous years and total U.S. ag exports remained comparatively lower as well.
Highly anticipated trade negotiations between the U.S. and China concluded on May 3, 2019 with no agreement. Soybean prices dropped over the next ten days, reaching the lowest level since 2007 (Figure 4). Shortly after, the U.S. lifted the tariffs on Canada and Mexico that had been in place for a year, taking necessary action to move toward settling a final USMCA agreement.
In May 2019, significant delays in U.S. planting progress due to widespread inclement weather and heavy precipitation also became evident (Figures 5-6). Near the end of May (Week 21), national planting progress for corn was only 58% complete compared to the prior five-year average of 90%. Similarly, planting progress for soybeans was 29%, compared to the prior five-year average of 66%. As the U.S. moved past what is generally considered the optimal planting window, productivity concerns grew.
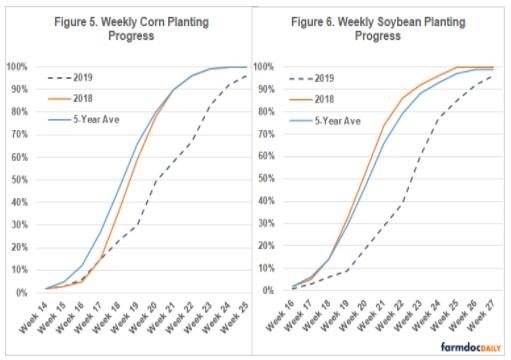
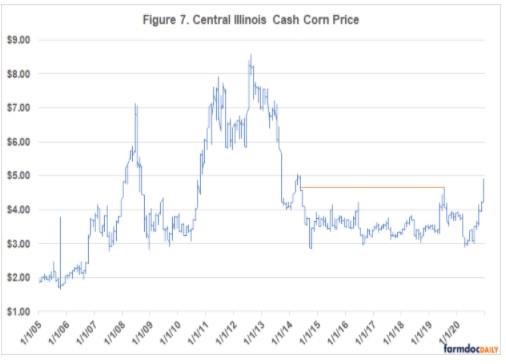
In addition, more than 19 million acres of U.S. cropland were unable to be planted to the intended crop, setting a record for prevent plant acres nearly double the previous record of 10.2 million acres set in 2011. Though a record occurrence, crop insurance was a contributing factor making the decision not to plant after a certain point easier. Regardless, the combination of late planting and record prevent plant acreage caused great uncertainty in overall production levels during the 2019 crop growing season, particularly for corn due to greater sensitivity to late planting and conversion of acres away from corn and toward other crops as the summer progressed. During this time, corn prices climbed to their highest level since 2014, rising 40% in the two-month period from mid-May 2019 to a mid-July 2019 peak (Figure 7). Prices began to retract as production concerns eased given survival of late planted crops and alternative plantings on some prevent plant acres after prevent plant dates.
The price retraction was further bolstered by the August 2019 USDA WASDE report that exceeded trade expectations for corn production resulting in the largest market surprise in at least two decades (farmdoc daily October 4, 2019). In the month between the August WASDE and the September WASDE, corn price dropped 15%. The September WASDE contributed to a reversal in downward price movement as the first report of the year to use objective yield surveys which indicated a slight drop in yield from the previous month’s surprise report.
During the 2019 summer months soybean price increased returning to price levels experienced throughout the second half of 2018 and first quarter of 2019. The movement in soybean price was likely more strongly correlated with China’s continued purchases at the highest levels since March 2018 than production concerns.
Throughout the month of September 2019, both the U.S. and China began exempting select products from tariffs on the other nation. Soybeans were among the agricultural products China exempted from additional trade war tariffs, contributing to positive price response for the commodity. In addition, mid-level trade talks in September concluded with the two countries agreeing on continued discussion.
Though higher than much of the tariff war period to date, harvest season U.S. agriculture exports trailed behind the normal level of exports in the same months.
The U.S. and China agreed upon a “phase one trade deal” in mid-December 2019. As part of the deal both countries suspended additional tariffs that were scheduled to take effect days later. Notably, the U.S. also agreed to reduce some of the other tariffs already in place while China pledged to increase purchases of U.S. goods and services over a two-year period. Prices of both corn and soybeans stabilized near pre-trade war levels of the first quarter of 2020.
Though the phase one trade deal was expected to be a positive market mover for agricultural commodities, COVID-19 was spreading throughout China and had already entered the U.S before the deal took effect in February 2020. The price of corn dropped in conjunction with the U.S. national emergency declaration in mid-March 2020, falling 10% in the week after the announcement, as shut-down and stay-at-home orders abruptly halted demand for corn ethanol used in fuel. The coronavirus pandemic and the control measures put in place as a response disrupted domestic supply chains for meat and dairy products, which affected short-term feed use for both corn and soybeans. Similar situations in countries around the world resulted in lower global demand and U.S. agricultural exports were relatively low all summer, resulting in the lowest monthly export level since 2016 in June 2020. The price of both crops remained depressed through the 2020 spring and summer months.
As states and nations began to release plans for re-opening and vaccination distribution throughout the summer and fall months of 2020, an economic turning point was initiated. Despite the slow start to the year, trade pace for U.S. agricultural exports picked-up beginning in August 2020, rising well above prior months. The trend continued through the end of the year reaching a new monthly record for U.S. agricultural exports in December 2020. During 2020, China was rapidly rebuilding its hog herd from the decrease in herd caused by African Swine Fever, likely another factor in special exemptions on soybeans and their resumed purchases. Soybean exports to China accounted for nearly half of the growth in U.S. agricultural exports between August and December 2020 resulting in a massive 48% surge in soybean price in that period. Corn price also escalated, rising 58%, likely a combined result of several factors including renewed global demand for feed grains and renewed domestic demand for ethanol in fuel. Both corn and soybeans ended 2020 at the highest price levels experienced in the entire three-year period and carried positive momentum into 2021.
Summary
This U.S. perspective timeline and narrative illustrate how a rare series of disruptive occurrences over the last three years has contributed to volatility in corn and soybean prices. Among the many factors that influence commodity prices, are exports, production level, domestic uses, and the macroeconomy. In recent years, the United States has experienced the impact of disruptions and changes in each of those factors. Though events of this 2018 through 2020 period could be considered outlier situations, such periods of change, disruption, and uncertainty will always be present. This underscores the importance of effective farm policy that can adapt to support the agricultural industry regardless of the situation.
Source : illinois.edu