By Sarah Sellars and Gary Schnitkey
Department of Agricultural and Consumer Economics
University of Illinois
Laura Gentry
Department of Natural Resources and Environmental Sciences
University of Illinois
The costs of machinery ownership and labor are two important factors when considering tillage decisions (
Swanson et al., 2020). In an October farmdoc daily article (
October 26, 2020), we examine tillage benchmarks for corn on Illinois farms in the Precision Conservation Management (PCM) dataset. Similarly, in this article, we explore tillage benchmarks for soybeans on Illinois farms in the PCM dataset and provide information about the types of tillage occurring and the average cost and returns for each tillage type.
Precision Conservation Management (PCM)
We summarize data from Precision Conservation Management (PCM) for soybean production on farmland in central Illinois from 2015 to 2019. PCM is a farmer service program led by the Illinois Corn Growers Association in partnership with over 30 entities including other commodity associations, conservation groups, private foundations, supply chain providers, the Soil and Water Conservation Districts, and the Natural Resource Conservation Service (NRCS). In an effort to address the goals of the Illinois Nutrient Loss Reduction Strategy, the mission of PCM is to help farmers make decisions about adopting on-farm conservation practices in a financially responsible way. Through PCM’s regional specialists, PCM works one-on-one with over 300 farmers enrolled in its 16-county service area, representing over 200,000 acres of Illinois farmland.
Tillage on Illinois Farms
The type of tillage used in Illinois has changed over time, with greater use of conservation tillage, particularly after the passage of the 1985 Food Security Act which required farmers to use an approved conservation plan on Highly Erodible Land (HEL). Most of these conservation plans use mulch-till or no-till on HEL. The introduction of glyphosate-tolerant soybeans in 1996 reduced farmers reliance on tillage for weed control which also encouraged increase of no-till soybean acres (Simmons and Nafziger 2009).
Figure 1 shows the percent of soybean fields summarized by the number of tillage passes in the PCM data from 2015 to 2019. A fall and spring tillage pass followed by planting would be a two-pass system. Most soybean fields in the dataset (45%) are no-till. Two or more tillage passes are used on 39% of soybean fields.
The percentage of fields in each tillage class changes over time as new farmers are added to the dataset and existing farmers within the dataset change their tillage practices. Figure 2 shows how the number of fields in each tillage class changes from year-to-year. The tillage classes are defined as follows:
- No-till – no-tillage before planting soybeans.
- One-pass-light – one tillage pass with light-intensity/low-disturbance tillage implement
- Two-pass-light – two tillage passes with light-intensity/low-disturbance tillage
- Two-pass-medium – two tillage passes that included one deeper tillage pass.
- Three-plus –three or more tillage passes, any disturbance level.
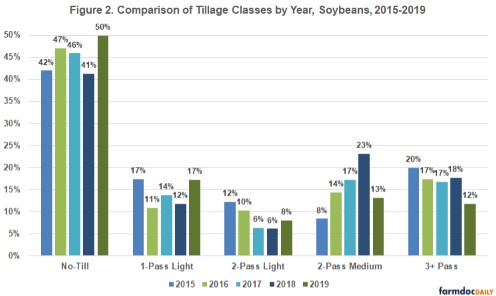
In 2019, there is a 9% increase in no-till and 5% increase in 1-pass light tillage as some fields shift from two-pass-medium and three-plus pass tillage to no-till and one-pass light tillage. The wet fall of 2018 and spring of 2019 likely prevented farmers from getting in the field for tillage, causing them to shift to no-till or one-pass tillage systems.
Returns and Tillage
For each field in PCM, the farmer indicated all their field passes, as well as input usage and yield. These data were used to develop an economic analysis of each field. This report included:
- Revenue from crop sales. The field’s crop yield was multiplied by a standard yearly crop price applied uniformly across all fields.
- Direct costs. Direct costs included seed, fertilizer, pesticides, drying, storage, and crop insurance. Actual input amounts recorded by each farmer were multiplied by a standard input price per unit and applied uniformly across all fields.
- Power costs. Each field pass was assigned a cost-per-acre based on Machinery Cost Estimates from the University of Illinois based on the farmer’s actual implement and a general tractor cost. The sum of all these field pass costs represented machinery-related power costs.
- Overhead costs. Overhead costs were based on Illinois Farm Business Farm Management Association (FBFM) data and applied uniformly across all fields.
These economic reports resulted in operator and land return, a measure of return for farmland. Operator and land return does not include land costs. Subtracting off a land cost, such as cash rent, would give a farmer net return.
Table 1 shows the average operator and land return, yield, direct cost, power cost, and total non-land cost by tillage benchmark from 2015 to 2019. On average, the 2-pass medium benchmark had the highest operator and land return at $364 per acre, followed by the 1-pass light benchmark at $342 per acre. The fields with three or more tillage passes had the lowest average operator and land return at $315 per acre.
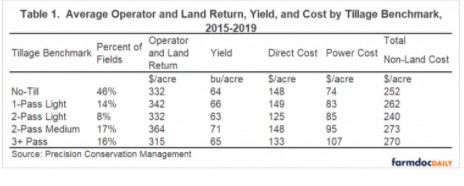
For yields, the 2-pass medium benchmark had the highest average yield at 71 bushels per acre followed by the 1-pass light tillage benchmark with an average yield of 67 bushels per acre. The fields in the PCM dataset are in different locations, so soil type, weather, and crop rotation influence yield. On average, no-till had the lowest power costs, and second-lowest total nonland costs relative to the other tillage classes.
Most Profitable Fields on High Productivity Farmland
The PCM dataset was further analyzed to evaluate the most profitable soybean fields. Only fields with soil productivity ratings (SPRs) at or above 130 were included in this analysis so differences would not be due to soil productivity. Figure 3 displays the top 25% most profitable soybean fields by tillage benchmark on high productivity soil. A total of 41% of the fields are no-till, demonstrating that no-till is the most common production system among the most profitable soybean fields on high productivity soils in central IL.
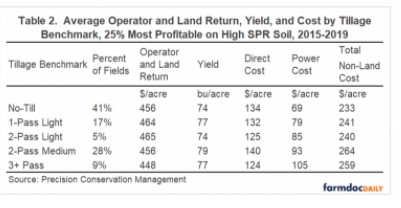
Table 2 shows the average operator and land return, yield, and cost for the 25% most profitable fields on high productivity soil. When looking at the most profitable fields, the difference in operator and land return between tillage classes decreases and no-till becomes competitive other tillage classes.
Conclusion
Almost half of the soybean fields in the PCM dataset are no-till. Although the 2-pass medium, 1-pass light, and 2-pass light tillage benchmarks tend to have higher operator and land return on average, no-till had the lowest power cost and lowest non-land cost of all tillage classes. When looking at soybean tillage on high productivity soil for the top 25% most profitable fields, 41% of the fields are no-till, showing that there are a significant number of no-till fields with high profitability. When examining the most profitable no-till systems, no-till is competitive with all other tillage classes. The reduced costs are benefits of the no-till system and there are additional benefits to soil and water quality from using no-till.
Source : illinois.edu