By Kevin Laurent
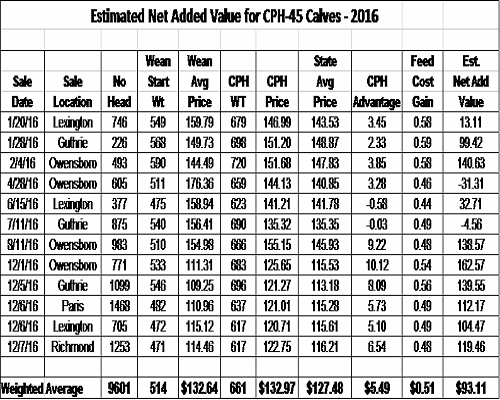
The CPH Report (Kentucky Certified Pre-Conditioned for Health) expands the analysis of CPH-45 sales to estimate the economic value of preconditioning calves prior to marketing. This report summarizes all CPH-45 sales held in calendar year 2016. Only sales of 200 head or more were included in this summary. Every attempt has been made to use as much actual data as possible in calculating these estimates (see the column descriptions below the tables for more details).
This analysis consists of two main components. First, is the CPH Advantage – which compares prices received in the CPH Sale to the average weekly statewide prices reported by the Market News Service of the Kentucky Department of Agriculture. Only large and medium frame muscle score 1-2 cattle in weight classes of 20 or more head were used in comparisons.
The second component is the Estimated Net Added Value – which compares the CPH Sale value of a calf with the estimated value of the calf at weaning. In these estimates we use a 60 day preconditioning period and an average daily gain of 2.5 lbs. per day. Calves with a calculated starting weight of less than 350 lbs were only given credit for 2.0 lbs of average daily gain. Costs incurred during the preconditioning period such as feed, health program, interest, death loss and differences in sales commission are subtracted from the added value to arrive at an estimated net return.
It should be noted that the Owensboro cattle are sold with a 2% pencil shrink and both Owensboro and Guthrie charge a lower commission for CPH-45 cattle than at their regular sales. Also note that the first three sales listed in this summary were calculated under the original 50 day preconditioning model.
More details on how these figures were calculated can be found in the column definitions below. Also, visit the CPH-45 website at www.cph45.com. If you are interested in selling in a CPH-45 sale, contact your local County Extension Agent for Agriculture and Natural Resources.

Column Definitions for summary charts:
Wean Start Wt.: Average CPH weight minus 150 lbs.
Wean Avg Price: Average price of calves at weaning for the dates listed (60 days prior to CPH Sale).
CPH Weight: Average weight of the calves at the CPH sale.
CPH Price: Weighted average price of calves at the CPH sale held on the listed date.
State Avg Price: Weighted average price of calves as reported by KDA on the dates listed.
CPH Advantage: Difference between the CPH price and the state average price reported the week of the CPH sale.
Feed Cost Gain: Average cost of gain using average feed prices for the dates listed. An additional 10% was added to calculate heifer cost of gain.
Est. Net Add Value: The net returns per head after feed, vet/tag ($12.00), mineral ($3.75), commission (varies by sale), interest (6.0%) and mortality (0.5%).
Source: osu.edu