By Scott Irwin
Department of Agricultural and Consumer Economics
University of Illinois
South America is a major contributor to global production and trade of corn and soybeans. For example, the latest USDA WASDE report indicates Brazil is expected to produce 37 percent of global soybean production in the 2020/21 marketing year and Argentina is expected to produce 14 percent, or just over half of global production between the two countries. This compares to 31 percent of global soybean production for the U.S. Corn production in Brazil and Argentina is not as large, but combined still represents 14 percent of expected global production in 2020/21. Given the size of corn and soybean production in these two South American countries, it is no surprise that the market pays such close attention every year to yield prospects in these countries. The starting point when forming yield expectations for any country is the trend yield and yield risks should be assessed relative to this benchmark yield. The purpose of this article is to estimate corn and soybean trend yields for Brazil and Argentina as well as the level of yield risk. The analysis updates the work found in several earlier
farmdoc daily articles (November 2, 2016;
November 9, 2016;
November 16, 2016;
December 14, 2016;
December 15, 2016;
January 12, 2017; and
January 26, 2017).
Analysis
National average corn and soybean yield data for Brazil and Argentina are collected from the
USDA/FAS Production, Supply and Distribution (PSD) database. We start all national average series in 1978 as this is the first year that soybean yields are available in the PSD database. First and second crop corn yields for Brazil are collected from
CONAB and begin in 1989. All data series are complete through 2020.
Figure 1 shows the national average corn yield for Brazil from 1978 through 2020. Yields have obviously trended higher over time, particularly since the early 2000s. A quadratic trend provides an excellent fit to the yields, with an R2 of 96%. The rate of growth in trend yields has been about 2.6 bushels per acre in recent years, somewhat higher than in the U.S. This trend model predicts a national average corn yield for Brazil in 2021 of 94.9 bushels per acre. Note the increasing variability of yields around the trend in the last decade. This in all likelihood reflects the growth of later planted second crop corn (“safrina”), which, we will show later, is riskier than the first crop of earlier planted corn.

Figures 2 and 3 divide the national average corn yield in Brazilinto the first and second crops, respectively. Note that the yield series for these two figures begins in 1989. The trend in first crop corn yields is quadratic, similar to the overall national average yield for Brazil. The predicted trend yield for first crop corn in 2021 is 98.9 bushels per acre, above the national average. The trend in second crop corn yields is linear rather than quadratic, and does not fit quite as well as in the case of national average and first crop corn. Nonetheless, the R2 of 89% is still quite high. The estimated slope coefficient indicates the trend rate of growth in second crop corn yield is 2.5 bushels per acre, which is basically the same as for first crop corn. The predicted trend yield for second crop corn in 2021 is 91.9 bushels per acre, below the national average and first crop trend yields.

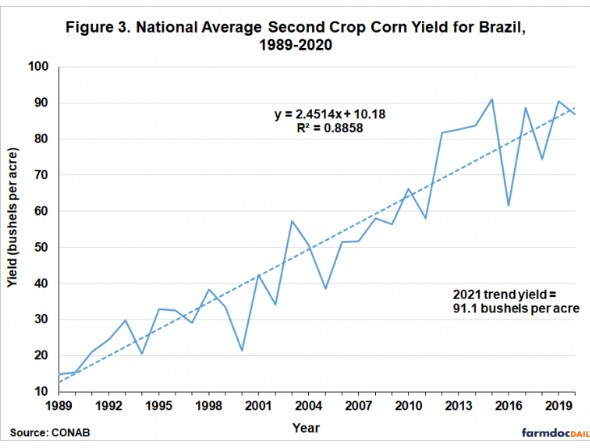
Figure 4 shows the national average soybean yield for Brazil. A linear trend fits soybean yields well, with an R2 of 91 percent. We also tried a quadratic trend but the fit was almost identical. The estimated slope coefficient indicates that, on average, soybean yields in Brazil have been growing 0.69 bushels per year since the late 1970s. The predicted trend yield for Brazilian soybeans in 2021 is 50.4 bushels per acre, which interestingly enough, is somewhat higher than most estimates of the 2020 soybean trend yield for the U.S.
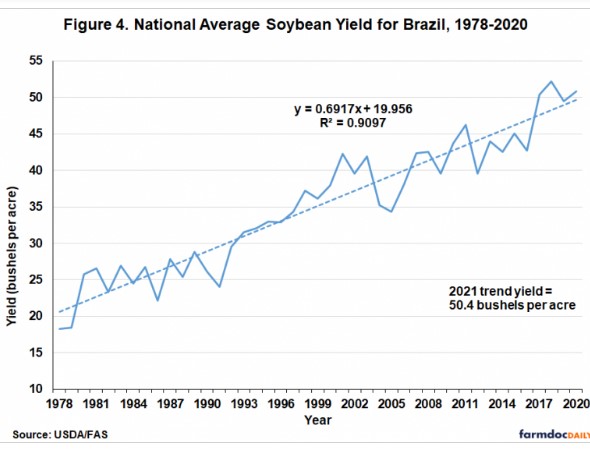
Figure 5 shows the national average corn yield for Argentina. There appear to be two distinct periods for trend estimation in this case. A quadratic trend is estimated for 1978 through 2006, and this fits the data well with an R2 of 90 percent. A sharp break occurs in the mid-2000s, with yield growth proceeding at a much lower rate. A linear trend estimated over 2007 through 2020 suggests yield growth of only 1.29 bushels per year, compared to trend growth in 1990s and early 2000s of 3 to 4 bushels per acre. The predicted trend yield for Argentine corn in 2021 is 127.4 bushels per acre.
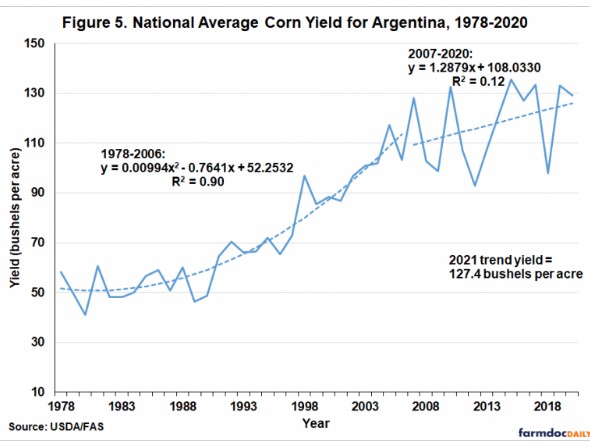
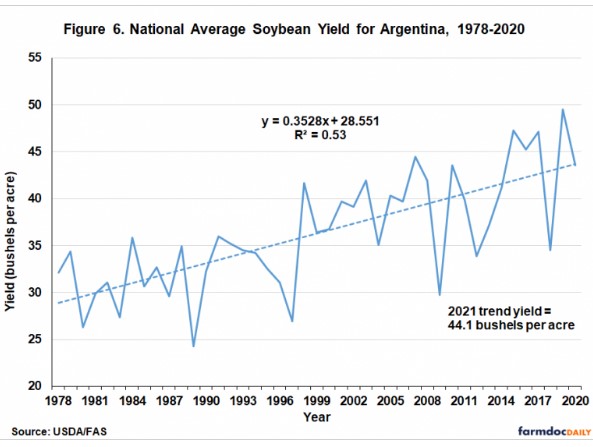
Figure 6 presents the national average soybean yield for Argentina. In this case, a linear trend model provides the best fit, but the explanatory power is still rather low, with an R2 of only 53 percent. The estimated slope coefficient indicates that, on average, soybean yields in Argentina have been growing 0.35 bushels per year since the late 1970s, almost exactly half the rate in Brazil. The predicted trend yield for Argentine soybeans in 2021 is 44.1 bushels per acre.
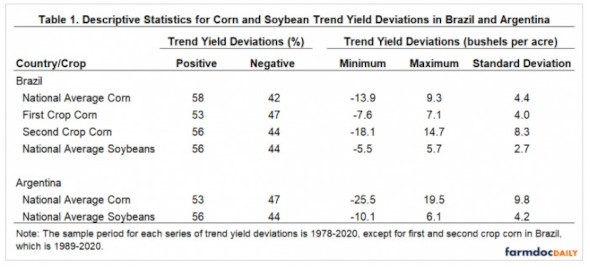
We now turn to consideration of yield risks for corn and soybeans in Brazil and Argentina. Table 1 contains several descriptive statistics on trend yield deviations for each country and crop. The first is the percentage of positive and negative deviations from trend yields. In all cases, positive yield deviations are slightly to somewhat more likely to occur than negative deviations. Across all six cases in Table 1, an average of 55 percent of trend yield deviations are positive and 45 percent are negative. The actual levels of trend yield deviations, of course, are much larger for corn than soybeans because the trend models are estimated in bushels. Note that in all but one case (national average soybean yield for Brazil) the absolute value of the minimum trend yield deviation is larger than the maximum trend yield deviation. This is a reflection of the well-known tendency of bad weather to reduce crop yields more than good weather increases yields. It is also interesting to observe that second crop corn yield in Brazil is considerably more risky than first crop corn. This is most directly seen in the fact that the standard deviation of trend yield deviations for second crop corn is more than twice as large as that for first crop corn. In addition, yield risks for corn and soybeans generally are larger for Argentina than Brazil.
Finally, it should be noted that the trend yield estimates presented in Figures 1-6 are “unconditional” regression estimates that are known to result in a slight under-estimate of trend yield due to the asymmetric effect of weather on actual yields (
Swanson and Nyankori, 1979;
Tannura, Irwin, and Good, 2008). As noted above, poor weather tends to reduce yields more than good weather improves yields so that the impact of technology (trend) is under-estimated due to sharp reductions in yield from poor weather years. (For those with a statistical bent this is more formally known as an omitted variables bias). We do not have a way of adjusting for this bias without constructing crop weather models for corn and soybean yields in Brazil and Argentina, which is beyond the scope of the present analysis. In any event, the magnitude of the bias is not expected to be very large, no more than a bushel for corn and half a bushel for soybeans.
Implications
An examination of average corn and soybean yields in Brazil and Argentina for 1978 through 2020 reveals upward yield trends in both countries. The estimated corn trend models point to a 2021 average corn yield of 94.9 bushels per acre in Brazil and 127.4 bushels per acre in Argentina. Based on the projections of harvested acreage in the USDA’s
December World Agricultural Production report, yields at trend value point to 2021 a Brazil corn crop of 4.574 billion bushels and an Argentina crop of 1.920 billion bushels. Similarly, the estimated soybean trend models point to a 2021 average soybean yield of 50.4 bushels per acre in Brazil and 44.1 bushels per acre in Argentina. Also based on the projections of harvested acreage in the USDA’s December
World Agricultural Production report, yields at trend value point to 2021 Brazil soybean crop of 4.806 billion bushels and an Argentina crop of 1.819 billion bushels. These estimates are near those found in the December
World Agricultural Production report.
The analysis in this article also reveals substantial annual variation of trend deviations in corn and soybean yields in Brazil and Argentina. A follow-up article tomorrow will investigate whether pre-season La Nina episodes, like the one underway, are predictive of negative yield trend deviations.