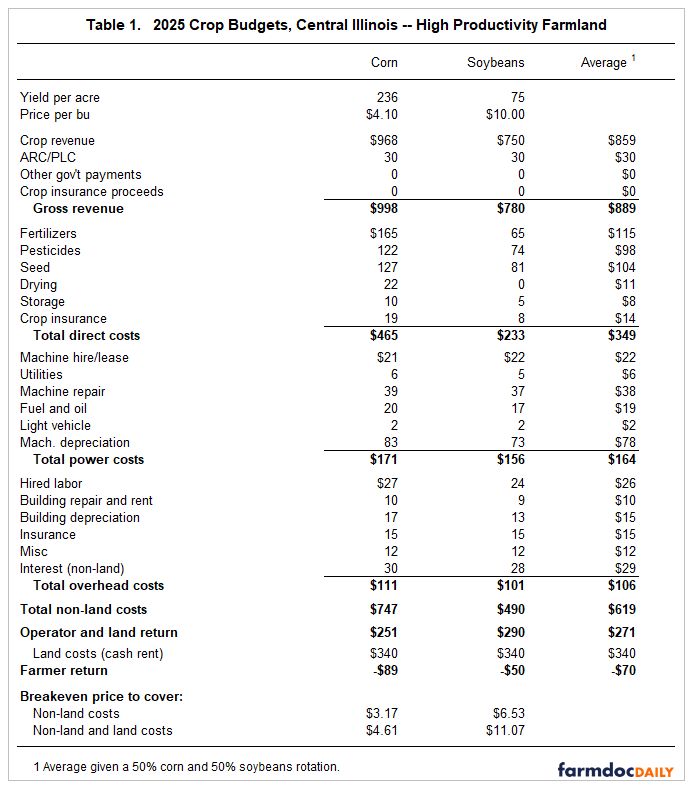
In this article, the 2025 Illinois Crop Budgets for corn and soybeans on high-productivity farmland are used as a base for making projections (see Table 1). Three modifications are made to this budget:
- Corn price is lowered from $4.30 per bushel to $4.10,
- Soybean price is lowered from $10.20 per bushel to $10.00, and
- ARC/PLC payments are increased from $10 per acre to $30 per acre.

The revised corn and soybean prices reflect fall delivery bids. Lower prices increase expected commodity title ARC/PLC payments from $10 per acre to $30 per acre. These commodity title payments, if received, will come in October 2026. In October 2025, commodity title payments will be received for the 2024 commodity year. Payments are unlikely for most areas of Illinois for 2024 as MYA prices are not currently expected to be below PLC effective reference prices, and county yields above ARC-CO benchmark levels are expected for most counties.
The 2025 crop budgets have cash rent at $340 per acre, the projected average for high-productivity Central Illinois farmland. At that cash rent, break-even prices to cover non-land and land costs are $4.61 per bushel for corn and $11.07 per bushel for soybeans, which are above the projected prices of $4.10 for corn and $10.00 for soybeans. As a result, farmer return from cash rent farmland is negative at -$89 per acre for corn and -$50 per acre for soybeans. The average farmer return for a rotation of 50% corn and 50% soybeans is projected at -$70 per acre.
Incomes are projected for a 1,500-acre farm, roughly the size of an average commercial farm in central Illinois. This farm will have $6,000 of income from other farm sources including patronage dividends and perhaps custom work. It owns 20% of its farmland (300 acres), share rents 40% (600 acres), and cash rents 40% (600 acres). Costs for owned, share-rent, and cash-rent land are:
Owned farmland: On owned farmland, the farmer will pay $60 per acre in property tax and have an interest cost of $150 per acre, for a total of $210 per acre in costs on the income statement. The $150 per acre in interest costs reflect a relatively low level of mortgage debt remaining on the farm, which is consistent with the financial position of most farms in FBFM. Many farms bought farmland in the past, made significant debt payments on those farms, and have seen farmland prices appreciate. These debt levels represent an established farm, not a beginning farmer making initial farmland purchases. The $210 in property and interest costs are $130 per acre below the $340 in cash rent. Hence, the 300 acres of owned land will add more to income than the cash-rented farmland. Of course, that comes after making a significant downpayment and many years of paying debt on the farmland.
Share rent farmland: In central Illinois, most share rental arrangements involve a 50% share of gross revenue and direct costs between the landowner and tenant. We calculated the equivalent cash rent for this share rent arrangement. The equivalent cash rent is the cash rent payment under a cash rent that results in the same returns to the farmer as the 50-50 share-rent lease. For the budgets shown in Table 1, the equivalent cash rent is $270 per acre. That value is $60 per acre below the $340 projected average cash rent. Therefore, an acre of share rent farmland will have a $60 per acre positive impact on net income compared to a cash rent acre. For a 50% corn and 50% soybean rotation, the operator and land return is $271 per acre, $1 per acre higher than the $270 equivalent cash rent. A $1 net farmer return is marginal and well below the near $100 returns farmers averaged in central Illinois since 2000 (see farmdoc daily, May 25, 2021 and September 17, 2024). Recent increases in costs have resulted in marginal returns to farmers when prices are near $4.10 for corn and $10.00 for soybeans.
Cash rent farmland: Cash rent farmland has an average cash rent of $340. Given a $271 operator and farmland return, cash rented land will have a -$70 per acre return to the farmer.
Projected 2025 Net Income
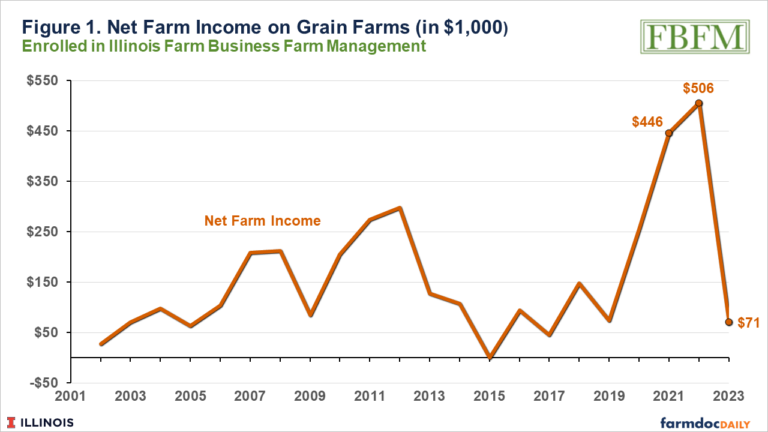
The 1,500-acre farm is close to the average of grain farms enrolled in Illinois Farm Business Farm Management (FBFM). Incomes for grain farms in FBFM were $446,000 in 2021, $506,000 in 2022, and $71,000 in 2023 (see Figure 1). The 2023 net income of $71,000 was close to the $72,000 net income per farm average from 2015 through 2019, a period where the financial position of Illinois farmers was stable to slightly declining (see farmdoc daily, October 8, 2024). Financial results for 2024 have not been summarized yet, but recent 2024 projection would place 2024 incomes significantly below $71,000 for 2024.

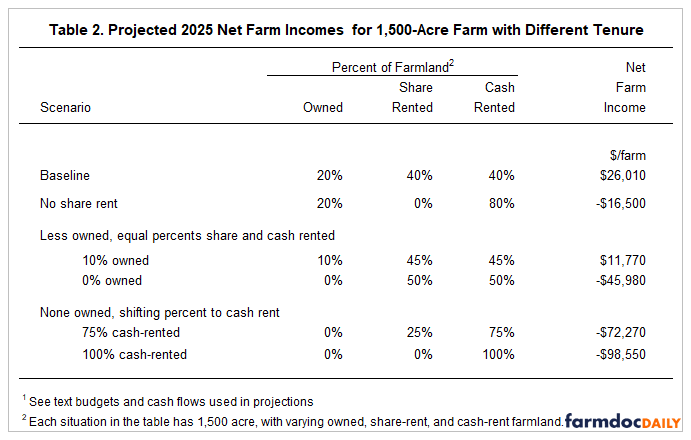
The projected net income for the 1,500-acre farm with 20% owned, 40% share-rented, and 40% cash-rented farmland is $26,010 (see Table 2). That income will likely be near 2024 when the recently released Emergency Commodity Assistance Program (ECAP) payments are included in 2024 income (see farmdoc daily, January 7, 2025). Current 2025 projections would result in a deterioration of the financial position of many farms (see farmdoc daily, February 25, 2025).

We evaluated a situation when there was no share-rent farmland; instead all rented farmland was cash-rented at $340 per acre. The projected net income in the “no share rent” scenario is -$16,500 per farm, a $42,510 decline from the representative farm baseline.
The 20% owned farmland significantly supports farm income. Reducing owned farmland to 10% or 150 acres rather than 300 while increasing rented acres by the same amount results in lower income. The “10% owned” scenario has $11,770 of income, $14,240 lower than the $26,010 baseline. If no farmland is owned, income is further reduced. The “0% owned” scenario is -$45,980.
When 0% of acres are owned, more acres in cash rent will further reduce income. A ”75% cash-rented scenario”, with 0% owned, has a projected net income of -$72,270. A “100% cash-rented” case has a projected net income of -$98,550.
Commentary
Income projections suggest 2025 will be another low-income year, resulting in financial deterioration on many farms. Most farms likely will withstand the financial deterioration because of income from other sources and because financial positions on farms are very strong (see farmdoc daily, January 9, 2025, October 8, 2024).
Owned farmland on many farms serves as a source of financial stability. On most Illinois farms, owned farmland has relatively small amounts of debt, leading to more income than from cash-rent farmland. Of course, there were financial sacrifices in the early years of those land purchases, as sizable downpayment needed to be made, and owned farmland likely did not service the initial debt requirements of that farmland.
Financial difficulties will not be even across farms. Farms with more rented farmland will be more vulnerable. Simply put, rental markets have not adjusted downward to make rented farmland profitable. In recent years, costs have increased (see farmdoc daily, September 24, 2024), so that farmer returns are negative at average yields and current projected prices. Cash rents will have to decline substantially for farms to be profitable with $4.10 corn and $10.00 soybeans prices. Even the traditional 50-50 share rent is not expected to provide a profitable alternative at current price and cost levels. Over time, some adjustments are needed in farmland rental markets if prices continue at their current levels of low $4 per bushel of corn and $19 per bushel of soybeans.
The above net farm income projections are made with a $4.10 corn and $10 soybean prices. Higher prices will increase prices if yields are close to projected. Similarly, incomes will increase with above-average yields if prices are near projected levels. Both are possible, but situations resulting in those occurrences are difficult to foresee at this point in time.
Acknowledgment
The authors would like to acknowledge that data used in this study comes from the Illinois Farm Business Farm Management (FBFM) Association. Without Illinois FBFM, information as comprehensive and accurate as this would not be available for educational purposes. FBFM, which consists of 5,000+ farmers and 70 professional field staff, is a not-for-profit organization available to all farm operators in Illinois. FBFM field staff provide on-farm counsel along with recordkeeping, farm financial management, business entity planning and income tax management. For more information, please contact our office located on the campus of the University of Illinois in the Department of Agricultural and Consumer Economics at 217-333-8346 or visit the FBFM website at www.fbfm.org.
Source : illinois.edu