By Gary Schnitkey and Jim Baltz et.al
Department of Agricultural and Consumer Economics
University of Illinois
Carl Zulauf
Department of Agricultural, Environmental and Development Economics
Ohio State University
U.S. corn yields has been increasing since the late 1930s. Current evidence suggests that U.S. yields are increasing between 1.9 and 2.0 bushels per year. While down from higher yield increases occurring in the 1960s and 1970s, historical evidence suggests that corn yields will keep growing. Historically, yield shortfalls of over 10% occur in 14% of the years. The frequency of yield shortfalls has not been increasing. While many have concerns over U.S. productivity and yield risks, perhaps because of climate change, recent experience with aggregate U.S. yields does not suggest yield increases are not occurring, nor has there been greater uncertainty in overall U.S. yields
Corn Yields
Figure 1 shows U.S. corn yields per harvested acre as published by the National Agriculture Statistical Service (NASS). The series began in 1866, the first year NASS published yield data. From 1866 to 1899, corn yields in the U.S. averaged 26 bushels per acre. Yields in the last five years, from 2016 to 2021, averaged 174 bushels per acre, a more than six-fold increase since the 1800s.
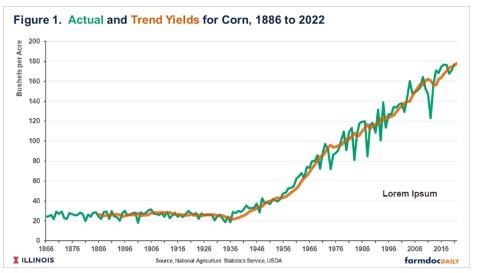
An increase in yields is first evident in the late 1930s. Breeding and hybridization of corn play a prominent role in this increase. The introduction of and improvements to fertilizer, pesticides, tillage and harvesting technologies, precision agriculture, biotechnologies, and information technologies also play a role. Farm management has improved as well.
Trend Yields
Besides showing actual yields, Figure 1 also shows yearly U.S. corn trend yields. A trend yield estimates the “most likely” yield for the upcoming year. For example, if a respective year could be repeated 100 times, the average of the repeated yields would be close to the trend yield. Trend yields in Figure 1 are based on fitting the previous 20 years of yields using a linear model with time as the independent variable. The slope on the time variable gives the average increase in yields over the past 20 years, or the annual “trend” estimate. The trend yield is then projected for the next year using results from the regression.
The trend yield for 2022 is 178 bushels per acre. In its World Agricultural Supply and Demand Estimates (WASDE) report for June, the Office of the Chief Economist used a 177 bushel per acre yield estimate for 2022. Either yield estimate is relatively high compared to historical yields. If it occurs in 2022, the WASDE yield will tie a record set in 2021, while a 178 bushel per acre yield would set a new national yield record.
Trend yield projections depend on the 20 years used to estimate the trend yield. Sometimes trend yields will go down when a low-yielding year occurs.
Pace of Yield Increases
The pace of yield increases can be measured by the slopes on the linear equations used in constructing trend yields (see Figure 2). For example, the slope on the 2022 trend is 1.9, meaning that the average annual yield increase between 2002 and 2021 is 1.9 bushels per acre. Until 1941, slopes were near zero, indicating that yields were not increasing. Slopes then increased, reaching a level of 2.8 bushels per acre in 1975. From the 1975 high, the slope decreased, reaching a low of 1.4 in 1995. Slopes then increased, reaching a high of 2.6 in 2008 before falling again to 1.4 in 2014. Slopes then rose and now stand at 1.9 in 2022.
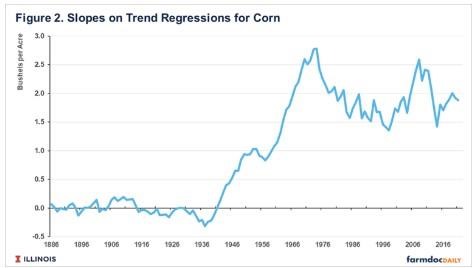
Low yields, particularly droughts, impact slopes estimated in this way (using the previous 20 years of actual yield data). A major drought occurred in 2012 when the actual yield of 123 bushels per acre was 23% lower than the trend yield of 161 bushels per acre. A drought near the end of the estimation period will lower the slope estimate, and drought at the beginning of the period will increase the estimate. Also, slope estimates likely were underestimated in the 1950s and early 1960s as the lower non-trending yields from the 1920s and early 1930s were still prevalent in the estimation
The slope estimates shown in Figure 2 point to consistent evidence of yield increases on corn in the U.S. since the 1940s. Current estimates put average annual yield increases in the 1.9 to 2.0 bushel per acre range.
Deviations from Trend
Figure 3 shows percent deviations from the trend. A positive value indicates that the actual yield is above the trend. Conversely, a negative value indicates that actual yields are below trend. Note that there is a period of yields above trend from 1938 to the mid1950s corresponding to the period in which corn yields began to increase.
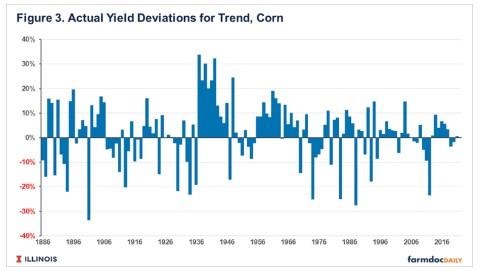
Deviations below the trend indicate adverse years. From 1886 to 2021, actual U.S. yields were at least 10% below trend in 14% of years, indicating that a 10% yield shortfall from trend is about a one-in-seven-year event. A 20% yield decline occurs in 7% of the years or a one-in-fifteen-year event.
A 20% yield shortfall is often associated with a Midwest drought. The last 20% yield shortfall occurred in 2012, the drought year when yields were off trend by 23%. Prior to 2021, the next 20% yield shortfall occurred in 1988 when actual yields were 28% below the trend yield. In 1988, a major drought occurred in the U.S.
The frequency of adverse yields has not increased. There were more yields 10% below trend in the period up to 1948, the midpoint of the years shown in Figure 3, than after. There were 19% of the years with a 10% yield shortfall during the period prior to 1948 compared to 10% after 1948.
Several periods stand out where negative shortfalls occurred with some frequency. One was the 1930s, when three years had yield shortfalls over 10%: 1930 (-22%), 1934 (-23%, and 1936 (-19%). The other period was the mid-1970s to 1988, when three years had three yield shortfalls over 20%: 1974 (-25%), 1983 (-25%), and 1988 (-28%).
Summary
Corn yields have been increasing since the late 1930s. In some sense, these increases are unremarkable because we have been experiencing yield increases for the last 80 years. Still, the continuing increase is a testament to the work done by agricultural companies and farmers to increase and expand production. The world would be a worse place without these increases.
There is no evidence that yield shortfalls have yet to begin occurring with more regularity. Climate risks may increase the potential for poor weather leading to yield shortfalls. That potential is not evident in aggregate data to date. Of course, corn breeding and farming innovations may be reducing downside risk, thereby countering adverse climate effects. In any case, increasing weather related production risks are not evident in existing aggregate yield data.
Source : illinois.edu