Area | Environment | Final Plant Population (plants per acre) | Seeding Rate* (seeds per acre) |
Northeast | 100-150 bu/a potential | 22,000-25,000 | 26,000-29,500 |
150+ potential | 24,000-28,000 | 28,000-33,000 |
Southeast | Short-season, upland, shallow soils | 20,000-22,000 | 23,500-26,000 |
| | Full-season bottom ground | 24,000-26,000 | 28,000-30,500 |
North Central | All dryland environments | 20,000-22,500 | 23,500-26,500 |
South Central | All dryland environments | 18,000-22,000 | 21,000-26,000 |
Northwest | All dryland environments | 16,000-20,000 | 19,000-23,500 |
Southwest | All dryland environments | 14,000-20,000 | 16,500-23,500 |
Table 2. Suggested irrigated corn final populations and seeding rates
Environment | Hybrid Maturity | Final Plant Population (plants per acre) | Seeding Rate* (seeds per acre) |
Full irrigation | Full-season | 28,000-34,000 | 33,000-40,000 |
Shorter-season | 30,000-36,000 | 35,000-42,500 |
Limited irrigation | All | 24,000-28,000 | 28,000-33,000 |
* Assumes high germination and that 85 percent of seeds produce plants. Seeding rates can be reduced if field germination is expected to be more than 85%.
New research on corn seeding rates
An intensive review of a large database from Corteva Agriscience (2000-2014 period) was utilized to synthesize yield response to plant population under varying yield environments (<100 bu/acre to >200 bu/acre). Overall, yield response to plant population depended on the final yield environment (Figure 1). In yield environments below 100 bu/acre, yield response to plant population was slightly negative. Yield response to plant population tended to be flat when yield environment ranged from 100 to 150 bu/acre; positive and quadratic with the yield environment improving from 150 to 180 bu/acre; and lastly, increasing almost linearly with increasing plant populations when the yield environment was more than 200 bu/acre (Figure 1).
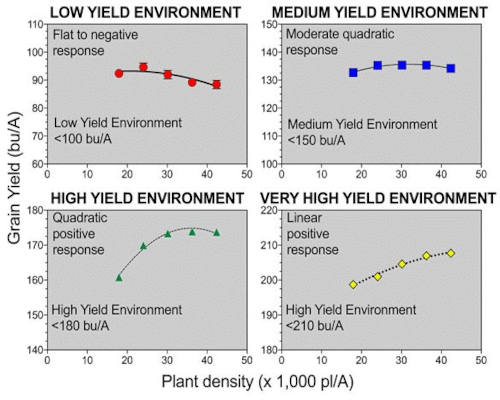
Figure 1. Corn grain yield response to plant density in four yield environments, a) <100; b) 100-150; c) 150-180; and d) > 180-210 bu/acre (Assefa, Ciampitti et al., 2016, Crop Science Journal).
As a disclaimer, “agronomically” optimum plant population does not always coincide with the “economically” optimal plant population. Lastly, final seeding rate depends on the environment, hybrid, and production practices (e.g., planting date, rotation, tillage).
The next step in our research study on yield response to plant density is to increase the level of prediction of agronomically and economically optimum plant density, based not only on the yield environment (or an average of past yield data), but also considering the available water at planting and the weather forecast for the growing season. Lastly, the corn yield response to plant density curves (solid lines) also present an uncertainty level (error, shaded areas) based on those main factors affecting yields (Figure 2). Including the risk level taking by farmers when selecting plant density is a relevant point of investigation in our future studies.
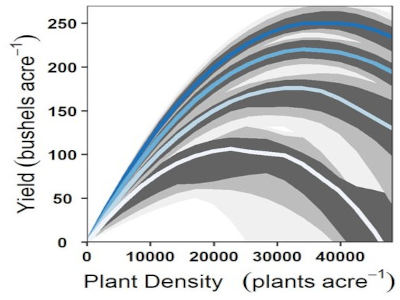
Figure 2. Corn grain yield response to plant density in four target yield environments (Lacasa, Ciampitti et al., 2020, Scientific Reports, https://www.nature.com/articles/s41598-020-72693-1). Solid lines are the main yield-to-plant density response curves for each yield environment and shaded grey areas represent the level of uncertainty on the predictions for each response model.
Source : ksu.edu