USDA’s Economic Research Service (ERS) reports data for a variety of costs incurred by farmers in the production of the major crops, milk (or dairy), hogs, and cattle. USDA reports production costs into two categories: (1) operating costs; and (2) costs for allocated overhead. Within those two categories are multiple costs or subcategories of costs and there are costs based on inputs or expenses applicable to some crops but not others.
The costs of producing milk are included in this background and discussion for perspective and comparison. The 2014 Farm Bill included a margin protection program for dairy farmers, which was modified in 2018 (see e.g., farmdoc daily, September 26, 2014; November 30, 2018; December 19, 2018; November 22, 2021). The Dairy Margin Coverage program defines margin as the difference between the price of milk and the cost of feed, which is measured as a fixed relationship among prices for corn, soybean meal and alfalfa (7 U.S.C. §9051). The dairy margin program responds to fluctuations in output and input prices, but not quantity. Variation in other costs is ignored. Payments are based on historic rather than current production volume.
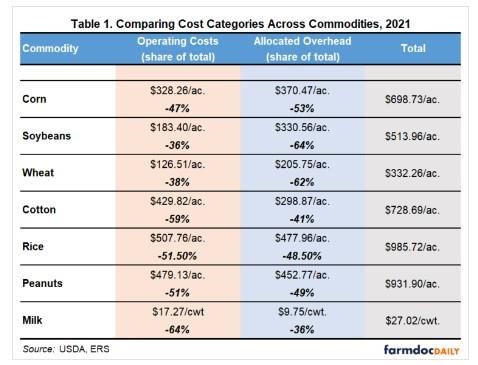
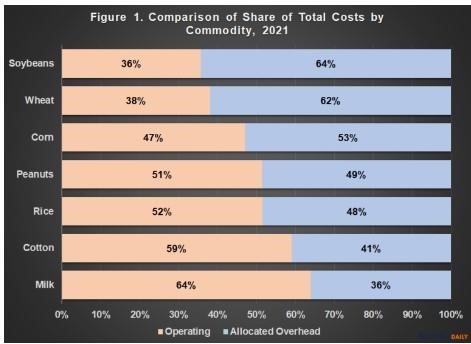
The most recent crop year for which USDA reports costs of production is 2021. For background, Table 1 summarizes the 2021 costs of production data and adds the percentage for each category of the total costs reported. The total costs vary by commodity, as do the share of the total costs attributed to operating or allocated overhead categories. For example, operating costs make up almost 36% of total costs for soybeans but nearly 64% of total costs for milk. Figure 1 illustrates the differences across commodities in the share of total costs due to operating costs and allocated overhead.
Discussion
The cost of production for a commodity is elusive in large part because of substantial differences in costs among the program commodities, as demonstrated in Table 1 and Figure 1. The amount of total costs varies across commodities. More importantly, the share of total costs attributed to operating costs and allocated overhead also differs significantly. If costs are used in program calculations, such differences will be incorporated and will impact operation of the policies. Most directly, the differences will impact the triggering of any payments, the size of those payments, and will drive disparities among commodities, farmers and regions.
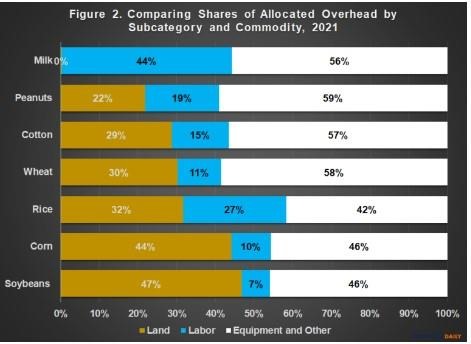
Beginning with the costs listed in allocated overhead, the specific costs reported by ERS have been divided into three subcategories for comparison and discussion. The first subcategory is land, reported as the opportunity cost of land. Second is labor and includes both hired labor and the opportunity cost of unpaid labor. The third subcategory includes equipment costs, reported as the capital recovery of machinery and equipment. It also includes all other or general overhead costs, which include taxes and insurance and general farm overhead costs. Figure 2 illustrates a comparison of the share of allocated overhead costs attributable to each of these subcategories by commodity.
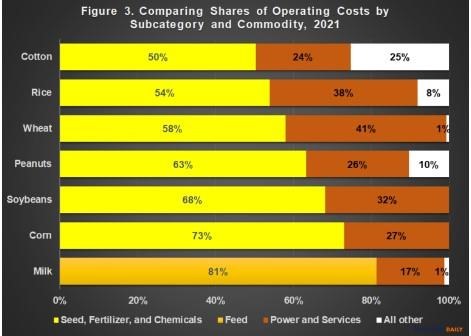
Further complications arise in reviewing and comparing the operating costs for the commodities. Costs vary by type of cost or subcategory, share of operating costs for each, and USDA also reports costs based on inputs or expenses applicable to some crops but not others. For this discussion, the operating costs are divided into three subcategories, but with differences for milk as compared to the row crops. The first pertains to direct input costs for the commodities. Specific to the row crops, these costs are for seed, fertilizer, and chemicals; specific to milk only, these costs are total feed costs (purchased, homegrown harvested, and grazed). The third subcategory is for power and services. For the row crops, it includes costs for custom services, fuel, lube, electricity and for repairs; for milk, it includes veterinary and medicine costs, custom services, fuel, lube, electricity and for repairs. The final category includes all other operating costs. For the row crops, these costs are for purchased irrigation water and interest on operating capital or interest on operating inputs. For cotton this category also includes ginning costs; for peanuts and rice, this category includes costs for commercial drying, while it includes other variable expenses for wheat and peanuts.
Figure 3 illustrates a comparison of the share of operating costs for these subcategories of costs for each of the commodities. Feed costs for dairy production are larger as a share of operating costs than are seed, fertilizer, and chemicals for any crop. Total feed costs are more than 80% of milk operating costs; seed, fertilizer, and chemical costs are 73% of operating costs for corn, but only 50% of cotton’s operating costs. The more diffuse nature of crop production costs suggests that the accounting necessary to calculate margins for a prospective crop margin program may be more complex than is the case for the existing dairy margin program.
Concluding Thoughts
The elusive nature of the cost of production for policy discussions about revising farm payment programs begins with the substantial variations and differences among program commodities. The challenge for policymakers involves which costs to include in program payment calculations. The decision on incorporating costs will alter program operation and will impact the payments received by farmers, both the size of payments and whether payments are triggered. In turn, those decisions will also drive disparities among commodities, farmers and regions. Such disparities could exacerbate existing inequities in payments as well as create new ones.
To demonstrate the complications involved in developing a prospective margin program, this article compares the shares of cost categories and subcategories for the major row crops and milk. In general, a prospective margin program will benefit commodities with higher shares of costs included in the margin calculation. For example, a program that considers only operating costs would be expected to benefit those crops with more of their costs attributed to operating expenses. Using all operating costs could benefit milk and cotton more than soybeans and wheat. If only direct inputs like seed, fertilizer, chemical, and feed costs are used, such a program might benefit milk and corn more than cotton and rice.
Similar challenges exist for the costs reported as allocated overhead. In general, using those costs would be expected to benefit soybeans and wheat more than cotton and milk; the opposite of using operating costs. Within the allocated overhead, different crops would benefit more depending on whether land, labor or equipment—or some combination of the three or the costs included within the subcategories—are used. Notably, labor costs for milk and rice are very different than for corn or soybeans, while land costs would likely benefit corn and soybeans more than milk or peanuts.
One final issue with incorporating costs that does not appear in the graphical comparisons involves the source of the items used for cost calculations and the impact of including them in a program payment calculation. Specifically, the costs used for the current dairy margin policy are from the farm sector as reported by USDA (7 U.S.C. §9052). These costs are driven by feed costs, such as the cost to purchase or produce corn, soybean meal, and alfalfa. In other words, the costs used are based on items produced by the farmer or other farmers. For the row crops, however, the main operating costs (seed, fertilizer, chemicals and fuel) are driven by items produced outside of the farm sector, such as the energy and manufacturing sectors. The implication for calculating farm program payments based on oil and natural gas, or on seed and chemical industries, is arguably different in important ways than for payments based on the prices of other agriculture commodities in the milk margin program.
Such issues are worth analyzing further because they may be relevant to a policy discussion. Taxpayers and policymakers may well be sensitive to how including such items may drive payment calculations and impact those sectors or industries, as well as agriculture. Cost-based payment calculations raise questions about the consequences for input prices or cash rent and land values, for example; whether such payments help the farmer or merely get passed through to industry or landlords, among other unintended consequences, need to be raised and analyzed. Finally, some may have strong concerns that such payments could exacerbate or contribute to existing challenges with externalities such as nutrient losses and greenhouse gas emissions. Elusive in 1933, the incorporation of costs in farm payment programs would be far more complicated in the modern era.
Source : illinois.edu