Center pivot irrigation systems rotate around a pivot point, typically located in the center of a field. In contrast, linear move irrigation systems move in a straight line (forward or reverse) and cover square or rectangular field areas.
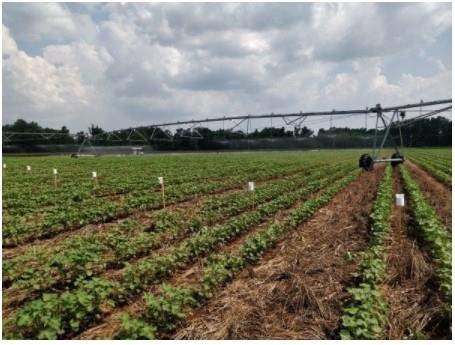
Figure 1. Center pivot irrigation system and setup of water collectors during a uniformity of water application test.
Both systems are comprised of an assembled series of linear pipes of varying lengths (e.g., 90 to 250 feet) that are supported by ground structures called towers (figure 1). The pivot sections between each tower are referred to as spans; on average, most pivots have five to seven spans.
Sprinklers installed along the main pipeline deliver water to crops as the system traverses the area of coverage. The sprinkler heads and nozzles (types, size, and spacing) may vary along the mainline to meet the discharge requirement and capacity of the irrigation system. The height and spacing of the sprinklers are key to maximizing the uniformity of application and minimizing runoff, evaporation, and drift.
The uniformity of center pivot or linear move irrigation systems is influenced by nozzle type and size, distribution of water flow, pumping pressure, and even wind. Center pivot irrigation systems commonly are equipped with an end gun (a large sprinkler) mounted on the end of the pivot mainline; it throws water a long distance thereby increasing the irrigated land.
Irrigation application uniformity is defined as the system’s ability to apply the same irrigation depth as it traverses a field. Poor uniformity of water application results in under- or over-irrigation of sections of crop fields. It also can lead to nonuniform distribution of fertilizer and chemicals where fertigation and chemigation are used.
Evaluating Water Application Uniformity
Some performance aspects of irrigation systems or sprinkler packages can be evaluated by conducting a water application uniformity test or catch can test. Three of the most common indices for evaluation are Christiansen’s uniformity coefficient (CUC), Heermann and Hein coefficient of uniformity (CUH), and distribution uniformity (DUlq).
Water application uniformity for linear move systems is assessed through the CUC index; for center pivot irrigation systems, the CUH index is used. CUH accounts for the change in area coverage of each sprinkler with respect to the distance from the pivot point. This is important because the sprinklers far from the pivot point and close to the end gun cover more acres compared to those closer to the pivot point. Both linear move and center pivot irrigation systems can be evaluated for distribution uniformity of irrigation water using the DUlq index.
Testing consists of measuring the amount of water applied by the irrigation system to determine specific problems and assess the overall water application uniformity. Following are the basic materials and supplies needed:
- Water collectors or catch cans of equal size and shape (height of at least 5 inches and a diameter of one-half to one times the height, or approximately 3.5 inches but not less than 2.5 inches
- Collector or can holders made of wood or metal (figure 1)
- Graduated cylinder to measure the water accumulated in each collector
- Long tape measure or measuring wheel
- Paper and pencil to record the data
Prior to testing, check for worn or clogged nozzles, missing sprinkler heads, and leaking boots (flexible unions between span pipes). These issues affect water pressure and reduce the uniformity and efficiency of water application. These issues should be fixed before conducting the test.
Steps to Conduct Uniformity of Water Application Test
1. Set the irrigation water collectors or cans.
On a center pivot irrigation system, install the collectors along a straight line perpendicular to the direction the pivot travels and evenly space them according to Standard S436 of the American Society of Agricultural and Biological Engineers (ASABE). In the case of a linear move system, install the collectors parallel to the main pipeline.
According to S436, the spacing between two collectors should be kept at 9.8 feet for spray devices and 16.4 feet for impact sprinklers. However, you could install one collector under each sprinkler if you want to identify specific problems with sprinklers or solenoid valves
on the pivot.
Place each collector on a holder in a way that all the collectors maintain the same height from the ground surface and are level. We currently use holders that keep the water collectors 8 inches above the ground surface. S436 indicates that the discharge elevation of each nozzle should be at least 3.2 feet above the elevation of each collector. Ideally, if the test is conducted before planting or at planting, anything that can interfere or prevent water from reaching the collectors should be avoided (figure 1).
2. Check weather conditions.
The wind and ambient temperature prevalent the day of the test could impact results. Windy and hot days might cause water to drift away from the cans or evaporate before reaching the cups. We recommend that you perform this test during a day with calm wind, ideally less than 2.2 mph, and temperatures lower than 75 degrees F. Avoid conducting this test if wind speed exceeds 11 mph. The accuracy of the test decreases when wind speed exceeds 2.2 mph.
3. Follow recommended irrigation system settings and operation during the test.
Make sure the irrigation system is operating at the pressure and flow indicated on the sprinkler package. According to ASABE Standard S436, the system, whether center pivot or linear move, should be set to apply an irrigation depth greater than or equal to 0.6 inches. The test should be conducted with the end gun in the operation mode identified in the sprinkler package.
Once all the collectors are set and before the test is initiated, move the pivot away from the line of collectors. You do not want any of the sprinklers to be directly above the collectors when the irrigation system is turned on and before the correct water pressure has been reached. Once these conditions are met, allow the pivot or linear move system to move in the direction of the collectors. When it passes completely over the collectors and water can no longer reach them, stop the test.
4. Record the amount of water caught by the collectors.
Use the appropriate size of graduated cylinder to measure the amount of water (in milliliters) accumulated in each collector. The applied irrigation depth (inches) can be calculated using the collector top area and the volume of water collected in it:
Collected depth (inches) = collected volume (inches3) ÷ collector area (inches2)
The water volume can be calculated and transformed into cubic inches (inches3) by dividing the milliliters collected by the factor 16.387.
5. Plot the data to identify uniformity of water application problems.
Create an Excel graph with the volume of water data recorded from each collector. The graph should have at least four data columns: sprinkler number, distance of each water collector from the pivot point, irrigation depth prescribed, and depth of water collected.
The horizontal axis of the graph indicates the distance from the pivot point data; the vertical axis is the final depth of water collected. Figure 2 displays the different problems of water application that can be identified using the data collected from the test.
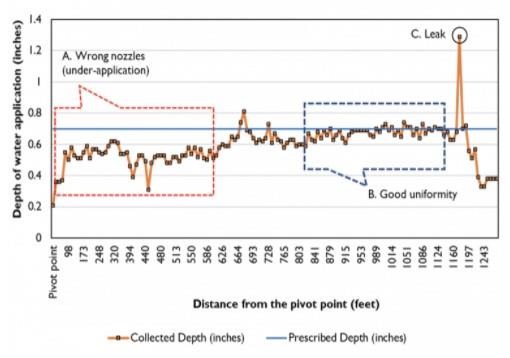
Figure 2. Common problems with uniformity of water application identified through a catch can test.
Assessing Water Application Uniformity and Distribution of Uniformity
Five examples of water application uniformity tests performed on four irrigation systems (table 1) are provided to help you identify performance differences between irrigation systems and assessment of what is acceptable versus poor water uniformity. The uniformity of water application was assessed using CUC, CUH, and DU indices.
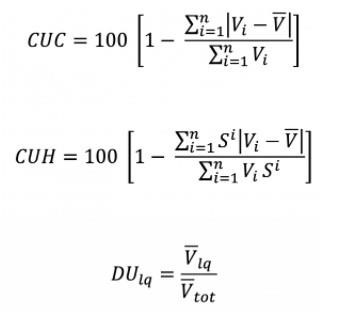
n = number of collectors used during the evaluation;
i = number used to identify each collector;
Vi = water caught by each collector (ml);
V¯ = average volume of water (ml) over all collectors;
Si = distance of each collector from the pivot point,
DUlq = low quarter Distribution Uniformity;
V¯tot = average of all the water measured from all collectors; V¯lq = average of the lowest quartile after sorting the water depth recorded from largest to smallest. For example, if you have 36 sprinklers, the lowest quartile would be the average of the lowest 9 measurements.
Table 1. Irrigation System Type, Basic Description, and Specifications
Table 2 shows results of five water application uniformity tests conducted on linear move and center pivot irrigation systems. It is not common for new irrigation systems to have uniformity of water application problems; however, problems might arise if those systems are not operated at their designed pump pressure.
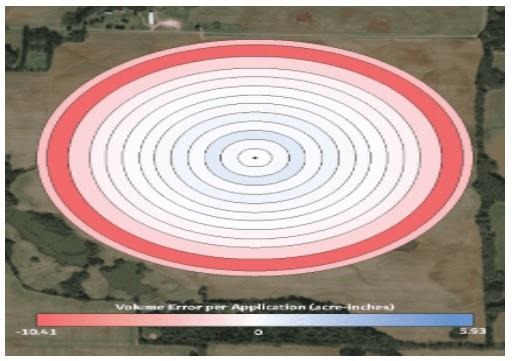
Figure 3. The wrong size nozzles can cause over- or under- application of irrigation water.
Values of coefficient of uniformity, CUC or CUH, above 90 percent indicate excellent uniformity with no changes or adjustments required. This was the case of pivot number 2 with a CUH of 93. This system is 2 years old and has only been operated one growing season. Irrigation systems number 1 (linear move system) and number 3 (center pivot system) had a coefficient of uniformity of 89.4 and 86, respectively, which indicates good uniformity (85 to 90 percent) with no major changes required unless a major problem is identified.
The pivot with the fair coefficient of uniformity (80 to 85 percent) corresponded to center pivot irrigation system number 4, case 1 (CUH = 80), a 12-year-old pivot. The uniformity of water application test indicated significant under-application of water on the outer spans of the pivot (figure 3).
During the uniformity test, the pivot was set to apply a uniform rate of 0.6 acre-inches. The test results showed under-application of 6 percent, 20 percent, and 14 percent on spans 11, 12, and the overhang, respectively (figure 3). The cause was associated with the use of smaller nozzles than indicated by the sprinkler chart. Smaller nozzle openings, also called orifices, restrict the flow of water, leading to decreased water application.
It is important to remember that outer spans travel much farther per revolution of the pivot and therefore cover substantially more area than inner spans; therefore, application errors (either under- or over-application) in outer spans may have disproportionately large negative impacts on yield as compared to inner spans.
In the case of the pivot in this example, spans 11, 12, and the overhang cover 127 acres, corresponding to 38 percent of the total irrigated area (329 acres). The uniformity of water application on pivot 4 was improved by replacing nozzles on spans 11, 12, and the overhang according to the sprinkler chart. After these changes were completed, a new test was conducted and uniformity was improved to 87 percent (system 4, case 2) (table 2).
Table 2. Results of Water Application Uniformity Tests on Four Different Irrigation Systems
Farmers and consultants should always refer to the sprinkler chart when replacing nozzles or spray plates on the pivot. Each nozzle is selected to operate at a specific pressure along the pivot. Avoid replacing broken nozzles with nozzles from other sections of the pivot or from other pivots.
The distribution of uniformity (DUlq) index indicates how evenly the water is being applied over an irrigated area or the magnitude of the distribution of problems. A DUlq of 85 percent or greater indicates excellent distribution of water (system 2) (table 2). The linear move system (system 1) exhibited a very good uniformity (0.81). The DUlq for system 3 is considered fair (DUlq = 0.72). A DUlq equal to or less than 0.7 indicates that maintenance is necessary.
The results of the water application uniformity test conducted on irrigation system number 3 indicated that some nozzles on spans 1, 2, and 3 were applying less than half of the prescribed rate, and under-application of water occurred over spans 5, 6, and the overhang, which are the spans covering the largest irrigated cropped area under the pivot (figure 4). Results from this test helped the farmer and irrigation operator conduct the appropriate maintenance and repair before the start of the irrigation period.
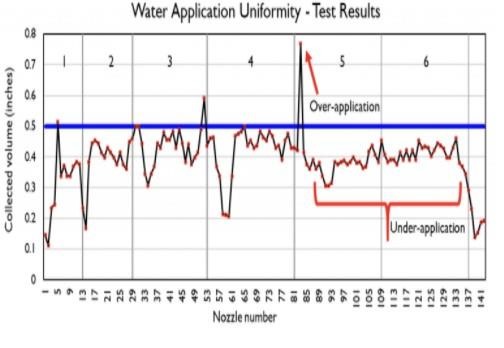
Figure 4. Problems with uniformity of water application identified through a catch can test (system 3).
Across all the irrigation systems evaluated, poor or unacceptable distribution of uniformity (DUlq less than 0.65) was found on the largest and oldest center pivot irrigation system (system 4, case 1) (table 2). Over time, the replacement of some nozzles on this pivot was not completed following the recommendations and calculations on the sprinkler chart; this caused significant under-application of water on the outer spans (figure 3).
Improvements of uniformity—from a DUlq = 0.65 to DUlq = 0.75 (good uniformity)—were achieved when nozzles were replaced following the sprinkler chart and the pivot was operated at the recommended pressure (system 4, case 2).
Evaluation of Irrigation Application from Variable Rate Irrigation Systems
Farmers have the option to equip irrigation systems with variable rate irrigation (VRI) controllers. These allow for the application of water and some agricultural chemicals at different rates over agricultural fields. Sprinklers are grouped into control zones, each operated by individual valves that typically control three to five sprinklers per zone.
On center pivot irrigation systems equipped with VRI controllers, different irrigation rates can be applied along the mainline. This is possible because the rate controller (e.g., solenoid-controlled valve) changes the duty cycle of an individual sprinkler or group of sprinklers (duty- cycle control method).
VRI systems are equipped with parts (electronics, solenoids, control valves, etc.) that are susceptible over time to damage, which may negatively impact water application. Testing VRI systems for uniformity of water application and the operation of the rate controllers is recommended before the start of a growing season and even during it.
We recommend a three-step evaluation process for VRI systems: (1) on-off cycling of sprinklers (pulse test); (2) control zones assigned to operate in on or off mode; and (3) ramp testing, where four or five different water application rates are assigned to control zones. These tests also require collection and measurement of the volume of water applied by each sprinkler on the irrigation system; therefore, the same guidelines of water collector setup outlined above also apply to these evaluations.
VRI System Testing Steps
1. On-off cycling of sprinklers (pulse test). Before initiating any test, perform a simple assessment of the rate controllers and sprinklers’ operation. On the VRI system panel, select the pulse test option and the length of time the sprinklers will pulse (e.g., 30 seconds). This pulse test will force all the sprinklers to open and close for a specific amount of time. For example, if 30 seconds is chosen, the sprinklers will open for 30 seconds and then close for 30 seconds.
The irrigation system does not need to walk while this test is running. The person conducting the test should walk along the pivot, inspecting the operation of every sprinkler to identify those that are not pulsing (either fully off or on). This could be an indication that the rate controller, solenoid, or control valve is not working properly. Once you have completed this inspection, proceed with step 2.

Figure 5. On-off test prescription map used for the VRI system test. “On” zones are solid blue.
2. Control zones assigned to operate in on or off mode. Evaluation of the application of different irrigation rates (i.e., application depths) on a VRI system follows the same protocol as systems that apply a uniform rate. The only difference is that irrigation prescription maps are used and groups of sprinklers are assigned to apply a specific water rate.
Set the water collectors as indicated on page 2 and create a VRI prescription map where groups of sprinklers (e.g., eight per group because VRI systems typically control four sprinklers at the same time) are assigned a specific irrigation rate (e.g., 0.6 inches) and others are off (0 inches). Repeat the irrigation rate assignment every eight sprinklers on the pivot (figure 5).
Note: Not all VRI systems control four sprinklers at the same time; the number depends on the VRI design. Some VRI systems even control the rate per individual sprinkler, not groups of them.
Upload the prescription map (figure 5) to the VRI system controller and run the test, allowing the irrigation system to travel completely over the water collectors. Measure the water collected to detect problems.
3. Ramp testing. This consists of applying three or more irrigation rates on a sequence. A specific number of sprinklers within a control zone are assigned a particular irrigation rate and a prescription map is created. Based on the VRI prescription map or rate prescribed to a pivot zone, sprinklers cycle (on and off) for a specific amount of time to reach the depth of water prescribed on the map.
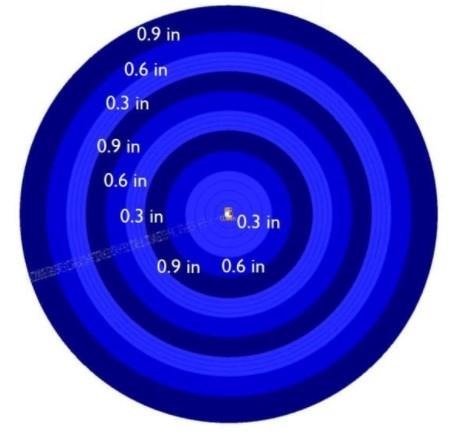
Figure 6. Ramp test prescription map used for the VRI system test.
Example (figure 6): Three irrigation rates are assigned: 0.9, 0.6, and 0.3 inches. A VRI prescription map is created so that each irrigation rate changes every eight sprinklers, and the sequence of three rates is repeated three times along the main pipeline. The rate of 0.9 inches corresponds to 100 percent sprinkler water application; the other two irrigation rates correspond to 66 percent and 33 percent, respectively, of the high irrigation rate. To achieve a 66 percent cycling rate, the VRI system signals to the control zone to open (on) for 40 seconds and close (off) for 20 seconds. A rate of 33 percent corresponds to 20 seconds on and 40 seconds off.
It is important to know the specific irrigation rate applied to each sprinkler. This will allow you to compare the prescribed and applied rates in order to identify problems with solenoid valves, clogged nozzles, and/or communication problems.
Once the water in each collector is measured, data can be input into an Excel spreadsheet for comparison of prescribed irrigation rates and the final rate applied. Figure 7 shows the results of the ramp test conducted the same day as the uniformity test (figure 1) on a six-span center pivot irrigation system. The 2020 VRI system test results demonstrated that starting 519 feet away from the pivot point and toward the pivot overhang (halfway, span 4, span 5, and span 6), the VRI system did not apply water (orange line on figure 7) according to the ramp prescription (blue line on figure 7), which indicates problems with the control valves. There also were significant irrigation problems toward the end of span 2 and the first half of span 3 (from 183 feet to 304 feet). The results from this test demonstrate the importance of evaluating the operation of irrigation systems before the start of the irrigation season.
The optimal performance of a VRI irrigation system is shown in figure 8. The VRI system in figure 7 was tested in 2019 and the results were acceptable. The orange line of the final applied rate in 2019 followed the prescribed irrigation rate in blue. The VRI technology for this example pivot (system 3, tables 1 and 2) gradually changed irrigation between adjacent control zones for the two different irrigation rates prescribed, as shown in figure 8. The differences in the performance of the VRI system between the 2 years could be due to damage to electronics from lightning or wear of the electronic, solenoid, or control valve components.
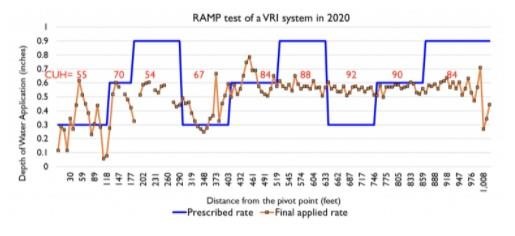
Figure 7. Comparison of the three different irrigation rates prescribed (0.3, 0.6, 0.9 inches in blue line) and the final applied rate (orange line) by the VRI system in 2020. CUH values per group of irrigation rates prescribed are in red.
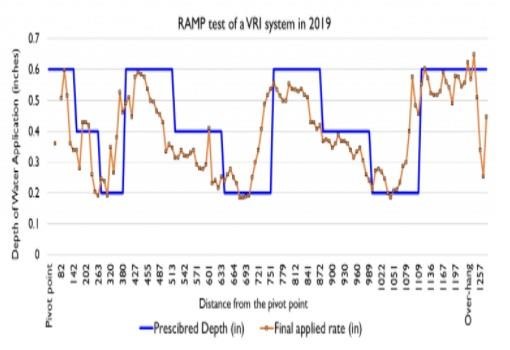
Figure 8. Comparison of three prescribed irrigation rates (0.2, 0.4, 0.6 inches in blue line) and the final applied rate (orange line) conducted in 2019 on the same variable rate irrigation system in figure 7.
Final Recommendations
- The water application uniformity test allows farmers and consultants to understand whether the system is operating properly or if there are uniformity problems caused by hardware (e.g., missing sprinklers, clogged or worn nozzles, solenoids, control valves, pipes) or software (e.g., electronics). Operating irrigation systems at a pressure higher or lower than the designed pressure will also impact water application by changing the water droplet size and distribution.
- Preventing malfunctions of irrigation systems could reduce under- or overapplication of water and chemicals that may impact crop growth, reduce harvested yield, have negative environmental consequences, and increase operating costs.
Source : aces.edu