Farmland Value
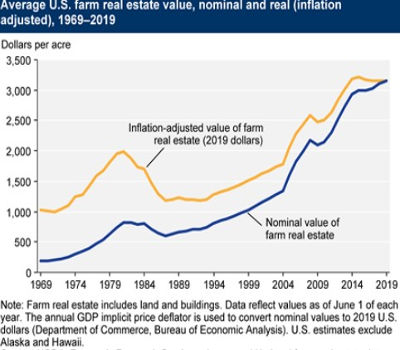
In recent years, farm real estate (land and structures) has typically accounted for about four-fifths of the total value of U.S. farm assets. (See more on farm assets and debt, including real estate.) Farmland values have stabilized since 2014, following a long trend of appreciation since the 1980s. However, there is regional variation in both farmland value levels and growth trends. The USDA Economic Research Service studies trends in farmland values, assessing the impact of both macroeconomic factors (such as interest rates and the prices of alternative investments) and parcel-specific attributes (such as soil quality, Government payments, rural amenity value, and urban proximity). U.S. farmland value remained high in 2019, averaging $3,160 per acre (a modest increase of 0.2 percent over 2018). Farm income was forecast to increase nationwide in 2019 (see Farm Income and Wealth Statistics for details.) This increase, combined with historically low interest rates, contributes to the ability of the farm sector to support higher farmland values. The figure below shows nominal and real (inflation-adjusted) national average farmland real estate values since 1969. While nominal farmland values have increased modestly since 2016, real farmland values have remained flat since 2014.
Regional farmland real estate values vary widely because of differences in general economic conditions, local farm economic conditions, Government policy, and local geographic conditions that affect returns to farming. For example, in the Corn Belt, farm real estate values are nearly twice the national average, while farmland real estate values in the Mountain region are less than half the national average.
Farm real estate growth trends also vary by region. Between 2018 and 2019, farm real estate values fell in the Corn Belt (down 1.9 percent to $6,100 per acre), Lake States (down 1.5 percent to $4,900 per acre) and the Southeast (down 0.8 percent to $4,090 per acre) in inflation-adjusted terms. In contrast, farm real estate values appreciated in the Pacific (up 3.3 percent to $5,900 per acre), Southern Plains (up 1.7 percent to $2,070 per acre) and Delta States (up 1.5 percent to $3,100 per acre). Over 2015-19, inflation-adjusted farmland real estate values in the Pacific, on average, have appreciated 14.5 percent, the most for any region, while values in the Southern Plains appreciated 6.6 percent. In contrast, farm real estate values fell by 12.8 percent in the Northern Plains and 8.6 percent in the Corn Belt.
Farmland real estate values vary according to agricultural use. Cropland maintains a premium over pastureland due to generally higher per-acre returns to crop production. Changes between 2018 and 2019 also varied according to use. U.S. average cropland value fell by 0.5 percent to $4,100 per acre in real terms, while pastureland value rose by 0.4 percent to $1,400 per acre.
The difference between cropland and pastureland values vary considerably by region. Cropland values are higher than pastureland values in every region except for the Southeast. In the Pacific region, cropland was worth four times as much as pastureland in 2019 ($7,190 vs $1,750.) Growth rates in cropland values vary across regions. Since 2015, cropland values have increased in the Pacific (8.2 percent) and Delta (4.7 percent), after adjusting for inflation. Cropland values decreased over the same time period in the Northern Plains (-15.9 percent), Corn Belt (-11.5 percent), and the Lake States (-6.2 percent). Pastureland value increased in in the Delta States region by 4.8 percent from 2015-19. In contrast, pastureland values fell in the Corn Belt (-9.2 percent), Lake States (-5.4 percent) and Appalachia (-3.3 percent).
Rental rates measure the value of using land for agricultural production in a given year. Between 2018 and 2019, average U.S. cropland rental rates decreased by -0.3 percent, to $140 per acre. Pasture rental rates, on the other hand, increased by 2.2 percent, to $13 per acre.
Between 2018 and 2019, cropland rental rates increased the most in the Pacific (up 10.2 percent to $305 per acre), Northeast (up 6.2 percent to $876 per acre) and Southeast (up 2.9 percent to $88.50 per acre). Cropland rental rates fell in the Mountain States (down 5 percent to $87.50 per acre), Corn Belt (down 2.2 percent to $203 per acre) and Lake and Delta States (down 1.7 percent to $153 and $111 per acre, respectively). Pastureland rental rates increased the most in the Delta States (up 6.5 percent to $19.50 per acre), Northern Plains (up 2.9 percent to $22 per acre) and Pacific (up 2.4 percent to $12.50 per acre). Pasture rental rates fell by 15.2 percent in the Northeast and 9 percent in the Lake States, to $31.50 per acre in both cases.
From 2015-19, cropland rental rates have declined in most regions in real terms, falling by over 9 percent in the Northern Plains, Corn Belt, Lake States, and Mountain regions. In contrast, cropland rental rates increased in the Northeast (6.7 percent) and the Pacific (8.5 percent). Over the same time frame, pastureland rental rates increased 3.5 percent in the Southeast region, while falling in the Northern Plains (-14.6 percent) and Pacific (-13.7 percent).
The USDA National Agricultural Statistics Service recently updated the estimates of average farmland real estate values per acre from 2015 through 2018, using data from the 2017 Census of Agriculture. Farmland real estate values were revised down in 2015 through 2018, between 0.66 percent and 1.62 percent. Cropland values were revised up modestly for 2015 (0.3 percent), but were revised down by 1.94 percent between 2016 and 2018. Pastureland values were revised down during the same period, from between 0.8 percent to 1.5 percent.
Average farmland value and cash rent by farm production region, 2019 (dollars per acre)