The Gardner Food and Agricultural Policy Survey is a recurring survey of approximately 1,000 US consumers that we will field on a quarterly basis. Each quarter, we will ask a base set of questions that are designed to monitor how public opinion on important food and agricultural issues changes over time. In addition, we will include timely ad hoc questions about new food and agricultural policy issues as they arise. This survey is a collaboration with Dr. Brenna Ellison at Purdue University, a former fellow of the Gardner Agriculture Policy Program.
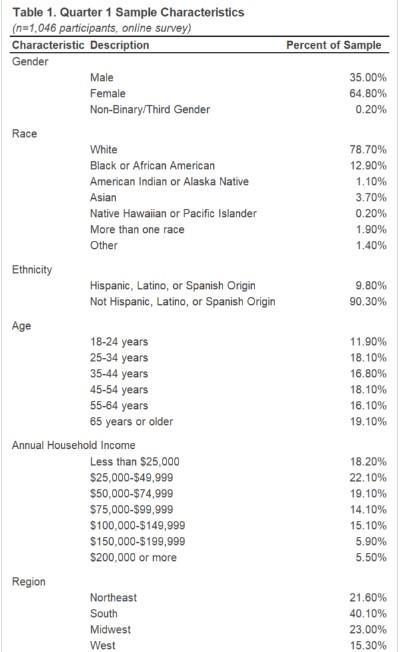
We completed Quarter 1 of the survey in May 2022. The survey was conducted online using US consumers. New respondents will be recruited each quarter to match the US population in terms of gender, age, income, and geographic region. Table 1 provides the sample characteristics for the Quarter 1 respondents.
Beliefs about the Food System
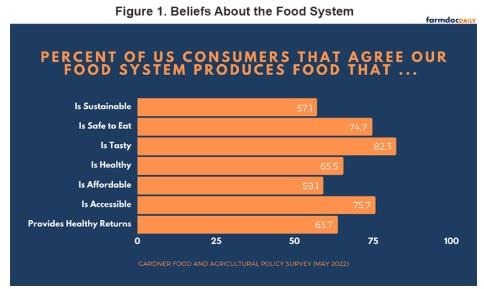
One aspect of the survey will be to measure Americans’ beliefs about the food system. In particular, we ask to what extent Americans agree or disagree the food system produces food sustainably, that is safe to eat, that tastes good, that is healthy, that is affordable, that is accessible, and in a manner that provides healthy returns for supply chain actors (e.g., farmers, manufacturers, grocery stores).
Figure 1 shows that in Quarter 1, most of those surveyed indicated they either somewhat agreed or strongly agreed that the food system produces food that is tasty (82.3%), accessible (75.7%), and safe to eat (74.7%). Nearly two-thirds of respondents (65.5%) agreed the food system produced food that was healthy. Despite the current inflation, 59.1% of those surveyed indicated they agreed the food system produces food that is affordable.
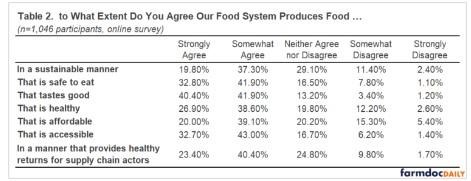
We also find that 57.1%of respondents agreed the food system produces food in a sustainable manner and that 63.7%agreed the food system provides healthy returns for supply chain actors. Table 2 includes a full breakdown of these results.
Trust in the Food System
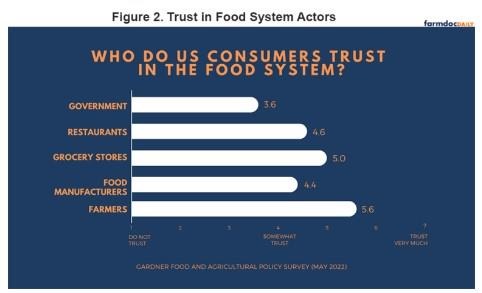
As part of this survey, we will also monitor trust in the food system. We asked participants to what extent they trusted various groups in the food system. The question was measured on a scale from 1 (meaning they do not trust this group) to 7 (meaning they trust this group very much). We asked participants to rate government, restaurants, grocery stores, food manufacturers, and farmers. Figure 2 presents the results.
In this first quarter, we found that farmers had the highest rate of trust, at an average of 5.6 out of 7. Following farmers, participants trusted grocery stores (average of 5.0 out of 7), followed by restaurants (average of 4.6 out of 7), and then food manufacturers (average of 4.4 out of 7). The lowest rates of trust for a group within the food system came for government, at 3.6 out of 7. In the coming quarters, continuing to ask about trust in the food system will allow us to monitor how trust changes across time, during food safety events, amidst policy changes, etc.
Concluding Thoughts
Although monitoring public opinion on agricultural and food policy issues is always relevant, with farm bill debate approaching and the myriad challenges facing farmers and the food system, understanding the public’s perspectives is arguably even more important. The Gardner Food and Agricultural Policy Survey will allow us to track how these perspectives change over time, and the results will help inform analysis, debates, and policies. Future articles will review the findings about climate change and the different types of federal policies.
Source : illinois.edu