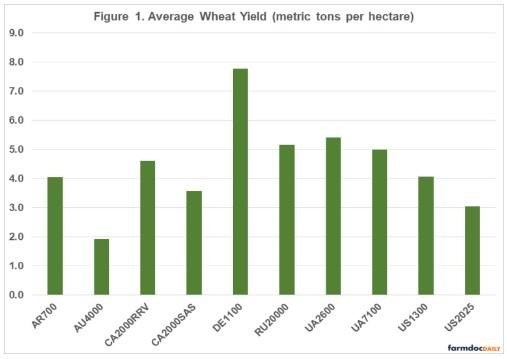
Wheat Yields
Although yield is only a partial gauge of performance, it reflects the available production technology across farms. Average wheat yield for the farms in 2015 to 2019 was 4.45 metric tons per hectare (66.2 bushels per acre). Average farm yields ranged from approximately 1.91 metric tons per hectare (28.3 bushels per acre) for the typical farm in Australia to 7.76 metric tons per hectare (115.4 bushels per acre) for the typical farm in Germany. Figure 1 illustrates average wheat yield for each typical farm. The farms in North Dakota and Kansas had average yields of 60.4 and 45.1 bushels per acre (4.06 and 3.03 metric tons per hectare), respectively.
Input Cost Shares
Due to differences in technology adoption, input prices, fertility levels, efficiency of farm operators, trade policy restrictions, exchange rate effects, and labor and capital market constraints, input use varies across wheat farms. Figure 2 presents the average input cost shares for each farm. Cost shares were broken down into three major categories: direct costs, operating costs, and overhead costs. Direct costs included seed, fertilizer, crop protection, crop insurance, and interest on these cost items. Operating cost included labor, machinery depreciation and interest, contractor cost, fuel, and repairs. Overhead cost included land, building depreciation and interest, property taxes, general insurance, and miscellaneous cost.
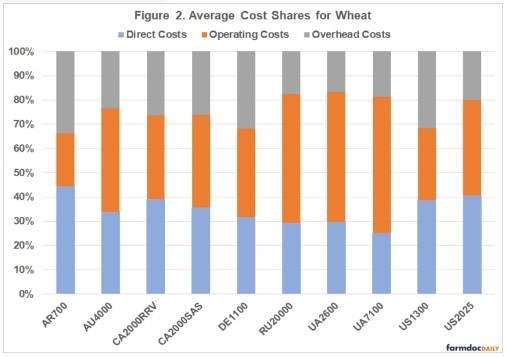
The average input cost shares were 34.9 percent for direct cost, 40.6 percent for operating cost, and 24.6 percent for overhead cost. The typical farms in Russia and Ukraine had the lowest cost shares for direct cost which includes crop establishment costs pertaining to seed, fertilizer, and pesticides. The typical farms in Argentina and in North Dakota had the lowest cost shares in terms of operating cost. Labor costs as a proportion of total costs were relatively higher for the typical farms in the Ukraine, the typical farm in Australia, and typical farm in Germany. Overhead costs as a proportion of total costs were relatively higher in Argentina, in Germany, and in North Dakota. In general, overhead costs are driven by land cost.
Revenue and Cost
Figure 3 presents average gross revenue and cost for each typical farm. Gross revenue and cost are reported as U.S. dollars per hectare. It is obvious from Figure 3 that gross revenue per hectare is substantially higher for the typical farm in Germany. However, cost is also substantially higher for this farm. The typical farms from Argentina, Canada, and Russia exhibited economic profit during the five-year period. In addition, the smallest typical farm in Ukraine also had a positive economic profit during the study period. Average losses per hectare for the typical farms in Australia, Germany, North Dakota, and Kansas were $23, $100, $48, and $68 per hectare, respectively, during the five-year period. The largest typical farm in the Ukraine had an average loss per hectare of $113. The lowest economic profit during the five-year period for the typical farms was 2019 with an average loss of $75 per hectare. Both 2015 and 2017 had an average economic profit that was positive.
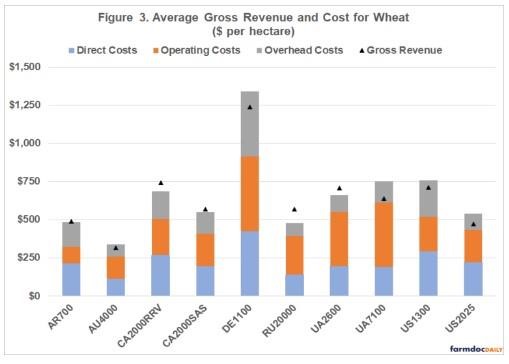
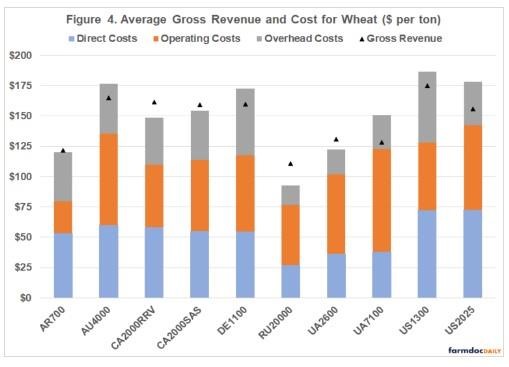
Figure 4 presents average gross revenue and cost for wheat on a per ton basis. Gross revenue per ton was relatively higher for the typical farms in Australia, Canada, Germany, and the United States. However, the typical farms in Australia, Germany, and the United States also had the highest costs per ton. Economic profit for the five-year period was the highest for the typical farm in Russia and the typical farm in the Red River Valley region of Canada.
Conclusions
This paper examined yield, gross revenue, and cost for farms in the agri benchmark network from Argentina, Australia, Canada, Germany, Russia, the Ukraine, and the United States with wheat enterprise data. The German farm had the highest yield. However, this farm had an average loss per ton of $13 over the 2015 to 2019 period. The typical farms in Argentina, Canada, and Russia exhibited a positive average economic profit during the 2015 to 2019 period. The data for 2020 will be available early this fall. It will be interesting to see how the strong crop prices that occurred in the later part of 2020 will impact comparative results.
Source : illinois.edu