By Nicholas Clark and Thomas Getts et.al.
This is the third post in a blog series focused on improving nitrogen (N) use efficiency in California small grains. This post discusses two hand-held devices that indicate plant N levels in small grains to help optimize fertilizer decisions. The tools help determine plant vigor by measuring light reflected from the whole plant canopy or absorbed by a single leaf. Comparing measurements made in and immediately outside of
N rich zones in representative areas of the field helps determine if the crop is likely to respond to more N fertilizer. The plant N levels indicated by the hand-held devices complement other important information, which are closely related to the crop N status such as recent
soil nitrate concentration, current crop growth stage, crop yield and protein goals, and local weather records to inform a site specific N fertilizer recommendation.
What are the devices, and how do you use them?
GreenSeeker by Trimble Agriculture is a hand-held normalized difference vegetative index (NDVI) meter (Figure 1). It emits red and infrared light and detects how much of each is reflected from the crop canopy. Chlorophyll in green plant tissue absorbs red light but not infrared light. As more red light is reflected off plants the NDVI value decreases. Higher NDVI levels indicate very-green plants, and lower NDVI levels indicate less-green plants. The GreenSeeker's canopy measurement will help indicate crop vigor—how well the plants are growing and covering the soil with greenness. This information about vigor is important early in the crop's growth because it indicates the plants' ability to support grain production and yield potential.
Taking GreenSeeker measurements:
o Make sure the device has been sufficiently charged.
o Hold the device 2-3 feet above the canopy and away from your body with its sensor pointed downward (Figure 2). An error message appears if the device is too close or too far from the canopy.
o Walk the length of the sample area (approximately 20 – 40 feet) while holding the trigger and do not release until you have covered the length of the sample area.
o The device will display an average NDVI value of the sample area you covered.
o Readings must be taken inside and outside of the N-rich zone.
o Multiple samples from different parts of the field are needed to make sure the information is representative of the whole field. Make sure to avoid abnormally bare, yellow, dense, or lush areas of the field. It might be necessary to divide the field into multiple production zones if there are known differences in productivity.
The
atLEAF CHL by FT Green LLC is a chlorophyll meter. Like the GreenSeeker, it also emits a red and infrared light. However, the atLEAF CHL measures how much of each light passes through a single leaf, instead of light reflected off the canopy. Since each device measures a different scale of the crop (i.e. the whole canopy versus a single leaf) they have different uses. The atLEAF CHL indicates the concentration of chlorophyll in the leaf. This information becomes increasingly valuable as an indicator of whether the crop has sufficient N as it begins heading out and filling grain.
Taking atLEAF CHL measurements:
o Collect 15-20 leaves from within and outside of the N-rich zone for a total of 30-40 leaves. The leaves sampled should be the second from last (i.e. leaf below the flag leaf) (Figure 3) collected from plants that represent, or look like, the average plant in the sample area.
o Leaves should be measured in a portion without variations such as disease lesions, dead areas, pesticide drift spots, or insect damaged areas. The chosen area should represent the overall greenness of the leaves.
o Make sure each leaf is properly placed in the sample reading area of the device. A piece of tape to mark the correct location on the outside of the device helps with positioning thin leaves in the sample reading area (Figure 4).
o Avoid direct sunlight entering the sample reading area, readings should be taken in shade or with the user's back to the sun to block direct sunlight on the device (Figure 5).
Both measuring devices are a proxy for plant N status, as plant N is strongly related to plant greenness and chlorophyll content.
It is important to remember that the absolute values given by the hand-held devices are only meaningful when compared to a reference zone, such as a
N rich zone. This is true because many factors can affect absolute greenness or chlorophyll values including species, variety, age, drought, water logging, insect or disease pressure, herbicide injury, or a thin canopy.
What do the readings mean?
After recording the readings, the data should be averaged to get one value for the N-rich zone and one value for the production area. Then the relative value of the production area can be determined by using the following equation:
The equation will usually result in a value that is a decimal between 0-1, sometimes referred to as a Sufficiency Index (SI). When the SI is below a certain threshold, it indicates that the production area is experiencing detectable N deficiency relative to the N-rich zone. Depending on the degree of N deficiency, crop growth stage, and yield and protein goals, N fertilization might be warranted or may not be beneficial. Determining how much N fertilizer to apply also depends on other important factors such as seasonal weather and site-specific management factors that we won't cover in detail here. Table 1 shows SI ranges for the GreenSeeker or atLEAF CHL and the associated plant N status.
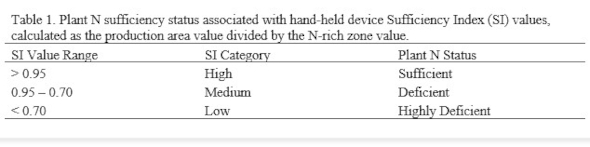
When it comes to deciding on N fertilization, a N fertilizer response is almost certain when the status is “Highly Deficient,” very likely when the crop N status is considered “Deficient,” and unlikely when the crop status is “Sufficient.” Keep in mind that there is always some variability associated with taking an average from a group of measurements. Also, if a large field has more than one N-rich zone, the plant status in the different parts of the field may not agree. As a result, if the SI value is on the cusp between “High” and “Medium” or is inconsistent among the different parts of the field, an
estimate of the soil nitrate concentration can provide additional information about the current N availability in the crop root zone. This can improve your interpretation of the plant N status when plant measurements are close to the sufficient/deficient threshold.
Finally, once it is decided whether to fertilize with N, the next step is to figure how much N is necessary. This can be determined using a crop growth and N uptake model in conjunction with yield and protein goals. Remember the hand-held devices are one tool in a suite of several we recommend for measuring crop N status and predicting a N fertilizer response. Earlier posts in this series (linked above) discussed some of these tools. Similar tools to the hand-held devices also measure crop N status such as satellite and drone imagery. Stay tuned for future posts in this series.