The average return to the operator’s labor and management income in 2021 was $374,403 (Figure 1). This figure can be thought of as the farmer’s “wage” or “salary”. This is what remains from the operator’s net farm income after a fair return to the operator’s equity in machinery and land has been subtracted. The 2021 returns were $185,562 above the 2020 average of $188,841 and $246,206 above the average for the last five years. Operator’s labor and management income ranged from about $309,500 in the central part of Illinois to over $430,000 in southern Illinois. The 2021 earnings are the highest for any year during the last ten years. Labor and management incomes have varied greatly during the last ten years, ranging from a low of negative $67,198 in 2015 to the high of $374,403 in 2021.
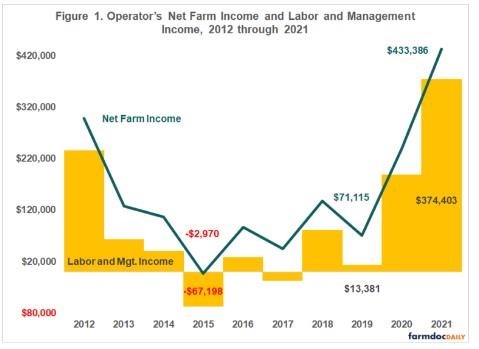
While the 2021 labor and management earnings are at historic high levels, one needs to remember that farm earnings, like earnings for many other businesses, can be cyclical in nature and have wide swings from year to year. Farm earnings are dependent on a number of factors outside the farmer’s control, such as weather, markets, and government policy. From that standpoint, it may be helpful to look at farm earnings over a longer period of time. The 2017 through 2021 five-year average of labor and management earnings was $128,197 while the 2012 through 2021 ten-year average of labor and management earnings was $93,927, $280,476 below the 2021 earnings. If you remove the 2 highest values on record that occurred in the last ten years (2012 and 2021) from the latest ten-year average, that eight-year average is only $41,179. The 2021 level of earnings is considerably above the last five and ten-year averages.
Crop Yields and Prices
Corn yields were above the relatively good yields recorded the year before. Corn yields were 10 bushels per acre higher in 2021 compared to yields recorded in 2020. Soybean yields were 5 bushels per acre higher than in 2020. The average corn yield on the 2,053 farms was 212 bushels per acre. Soybean yields averaged 67 bushels per acre. Corn yields were generally highest in the east central parts of the state, but the southern part of the state saw the largest increase in yields over 2020. Soybean yields were the highest in the central part of the state along the I-72 corridor. Wetter weather conditions during the spring in parts of central and western Illinois lowered corn yields in those areas of the state relative to east central parts of Illinois. The average corn yield was the fourth highest on record and the average soybean yield was the second highest. Year-end inventory price for the 2021 corn crop of $5.75 per bushel was $1.00 per bushel higher than a year earlier. Soybeans were inventoried at $12.50 per bushel, 50 cents lower than December 31, 2020. The average sales price received for the 2020 corn and soybean crop sold in 2021 was below their inventory prices. Crop returns averaged $1,064 per tillable acre, $204 per acre higher than the 2020 crop returns. The average crop returns per acre were at an all-time high.
Earnings by Farm Type
Wages earned by farm operators were highest on hog farms followed by beef, grain and dairy farms. Returns to operator’s labor and management averaged $707,451 on hog farms, $409,800 on beef farms, $385,959 on grain farms and $106,294 on dairy farms. Farms classified as grain farms were 93 percent of all farms while hog farms comprise one percent of the total. Livestock farms many times also include returns from grain production as well. Thus, most livestock farms, besides dairy farms, had higher returns than grain farms due to having higher returns from grain and livestock on those farms.
The average size of these farms continues to grow, averaging 1,286 tillable acres in 2021. This was 23 acres larger than the previous year and 125 acres larger than five years ago. Farms classified as grain farms averaged 1,336 tillable acres compared to dairy farms, which averaged 549 tillable acres.
Costs Continue to Increase
Per acre fertilizer, chemical and seed costs were higher compared to the year before and five years earlier, except for seed costs. Crop costs on the 2,053 farms averaged $261.32 per acre in 2021 compared to $240.18 in 2020. Fertilizer increased 9 percent, pesticides increased 20 percent and seed increased one percent. Tillable acres planted to corn decreased by 1.9 percent while acres plated to soybeans increased by 1.8 percent when compared to 2020. Compared to 2017, fertilizer costs have increased 13 percent, pesticides have increased 21 percent and seed has decreased one percent. Fuel and oil costs averaged $22.87 in 2021 compared to $18.35 in 2020 and $19.08 in 2017. These costs are expected to continue to increase in 2022 and 2023.
Spending for machinery and equipment was considerably higher than the year before. Expenditures increased 41 percent in 2021 compared to 2020, averaging $224,762 per farm, or $175 per tillable acre. Machinery purchases in 2020 averaged $126 per tillable acre while 2019 averaged $110 per tillable acre.
Costs to Grow Corn and Soybeans
Total economic costs per acre to produce corn and soybeans in 2021 increased as compared to 2020 in all areas of the state. The main factors for the increase in per acre costs was due to higher fertilizer, pesticides, machinery, insurance and land costs. Cost per bushel to produce corn increased in all areas of the state except for southern Illinois due to much higher yields compared to 2020. Costs per bushel increased due to higher costs per acre. Cost per bushel to raise soybeans increased in all areas of the state except for southern Illinois and central Illinois with the higher rated soils. Total economic costs per acre to raise corn and soybeans on these farms averaged $936 and $695 respectively.
From a sample of pure grain farms in the state, the total economic costs per bushel of corn produced were $4.39 with an average yield of 213 bushels per acre. The total costs per bushel of soybeans were $10.22 with an average yield of 68 bushels per acre. This compared with costs per bushel of $4.27 and $10.24 for corn and soybeans respectively in 2020. Even with the high yield, this was the fifth highest cost per bushel to grow corn since 2012. The 2021 cost to grow soybeans per bushel was about equal to the last five-year average, but lower than the ten-year average. This was the lowest cost per bushel since 2018. The variation in yields and costs the past few years makes it important to analyze these costs over more than one year. The 2012-2021 five-year average to produce corn and soybeans on these farms is $4.22 per bushel for corn and $10.20 per bushel for soybeans.
Livestock Returns
Returns above feed cost was higher than the year before for all livestock enterprises except dairy enterprises. Also, except for dairy, returns to all five enterprises in 2021 were above the last five-year average. All livestock enterprises experienced higher feed costs in 2021 compared to 2020. Higher pork prices were the main factor for the higher hog returns. Returns for farrow-to-finish hog producers were estimated to be about $5 per hundredweight above the breakeven level in covering total economic costs in 2021. Dairy producer’s experienced lower returns due to higher feed costs that were not offset with similar increase in milk prices, $2,269 returns above feed per cow in 2021 compared to $2,736 in 2020. Milk prices were less than one percent higher while feed costs were 12 percent higher compared to the year before. Returns to feeder cattle enterprises were higher than the year before but only the second highest for any year in the last five years. Returns were higher due to higher prices received for market cattle. Prices paid in 2021 for replacement cattle were 9 percent above the year before. Cattle prices received were about $28 per hundredweight lower than prices paid for replacement cattle. Returns above feed per cow increased $51 for beef cow enterprises due to higher prices received. Returns were the second highest during the last five years.
Good Records A Key
The author would like to acknowledge that data used in this study comes from the Illinois Farm Business Farm Management (FBFM) Association. Without Illinois FBFM, information as comprehensive and accurate as this would not be available for educational purposes. FBFM, which consists of 5,000+ farmers and 70 professional field staff, is a not-for-profit organization available to all farm operators in Illinois. FBFM field staff provide on-farm counsel along with recordkeeping, farm financial management, business entity planning and income tax management. For more information, please contact our office located on the campus of the University of Illinois in the Department of Agricultural and Consumer Economics at 217-333-8346 or visit the FBFM website at www.fbfm.org.
A video representation of this and other 2021 results can be found on the farmdoc YouTube channel at https://go.illinois.edu/FBFM2021
Source : illinois.edu