Figure 1. Map of Pivot Bio on-farm research study locations in Nebraska.
Kevin and Korbin Kudera: A Nitrogen Focus

Photo courtesy Kevin Kudera
Kevin Kudera and his son, Korbin, farm in Colfax County. The Kuderas got started with the Nebraska On-Farm Research Network through the Nebraska 4-H Innovative Youth Corn Challenge and Youth Crop Scouting Contest. Korbin — now a senior agronomy major at UNL — has continued conducting on-farm research, evaluating various aspects of nitrogen management, including sidedress applications and the pre-sidedress nitrate test. This year, the Kuderas decided to evaluate Pivot Bio through an on-farm research study due to their interest in increasing nitrogen use efficiency on their farm.
“We are looking at nitrogen efficiency — we’d like to increase our yields, but not increase our nitrogen rate,” Kevin Kudera explained.
“It seemed like a very good product, if you could replace some nitrogen [fertilizer] you’d have to buy,” Korbin Kudera said.
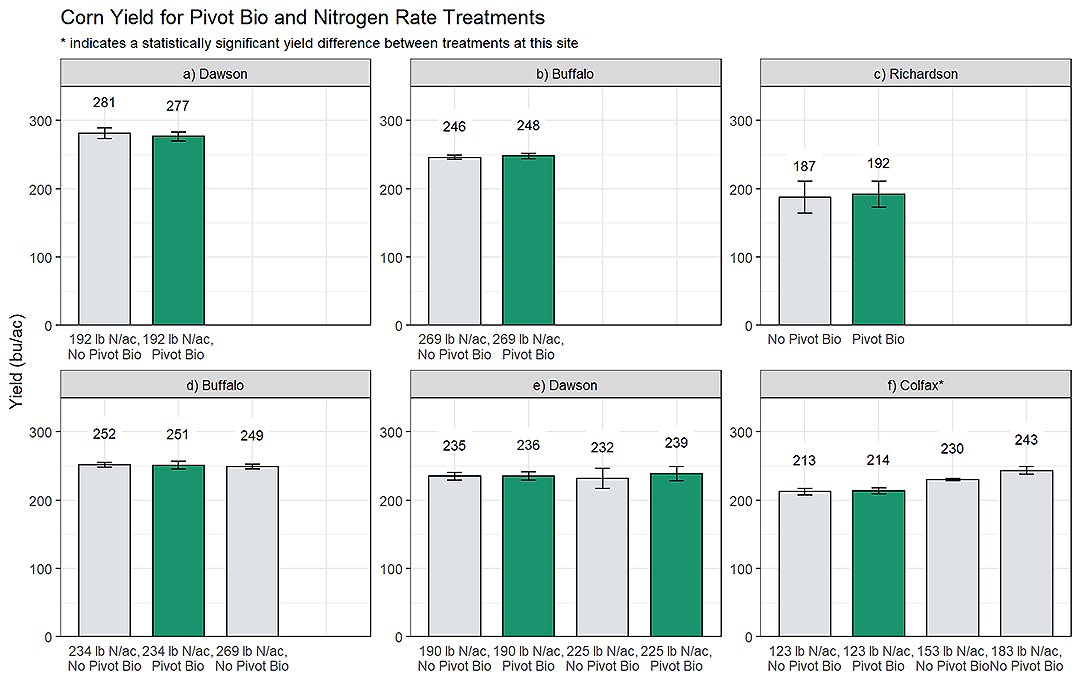
The Kuderas tested three different N rates, 123 lb N/ac, 153 lb N/ac, and 183 lb N/ac with four replications of each treatment (Figure 2f). Pivot Bio PROVEN®, applied with starter fertilizer, was tested at the lowest N rate of 123 lb N/ac. While they saw a positive response to N fertilizer, they did not find a yield increase for applying Pivot Bio PROVEN® at the 123 lb N/ac rate (Figure 2f).
“The first test trip through the field did show that Pivot Bio had a little advantage — we thought, ‘well that’s great,’” Kevin said.
But as they harvested the remainder of the plot, they saw that the response was inconsistent. In the end, it averaged out that the 123 lb N/ac rate with and without Pivot Bio PROVEN® yielded the same.
“That told me the value of doing multiple replications and randomization,” Kevin said.
While the Kuderas did not find a positive response for Pivot Bio PROVEN®, they don’t plan to give up on their goal of refining fertilizer management. In 2022, they plan to shift the focus of their on-farm research to look at the impact of starter fertilizer on soybeans.

Mark Kottmeyer: Through the Eyes of a Crop Consultant
 Photo courtesy Mark Kottmeyer
Mark Kottmeyer, a crop consultant and president of Central States Agronomics, Inc., worked with several growers to conduct studies on Pivot Bio products around Kearney and Lexington, Nebraska. Kottmeyer and the growers were motivated to do on-farm research so that they could have their own data to use in future decision-making.
“Of course, nitrogen fertilizer costs are so high, that’s part of the reason. It [Pivot Bio] is being promoted heavily in the area, so I guess that’s part of it, too,” Kottmeyer explained. “… We wanted to look at it and make our own decision.”
Kottmeyer and his growers work with the logistics and technologies available in their operations to make on-farm research more convenient and easier to do.
“… With the GPS technology we have and recording yields on-the-go, it’s way easier to do than what a person might think,” Kottmeyer explained. “The UNL personnel help you do a good job with it, and help you analyze it, and it’s really not as much effort as I’m sure people think it would be.”
For two of the studies, Kottmeyer’s growers evaluated with and without Pivot Bio PROVEN® at the same N rate (Figure 2a and 2b). In the Dawson County site (Figure 2a), the grower implemented 10 replications of the treatment strips, and in the Buffalo County site (Figure 2b), the grower implemented seven replications of the treatment strips. In both cases, the use of Pivot Bio PROVEN® did not result in a statistically significant yield increase.
In a third study (Figure 2d), the grower evaluated their standard N rate of 269 lb N/ac versus a 30 lb/ac reduction in N fertilizer (234 lb N/ac). They evaluated Pivot Bio PROVEN® 40 at the lower N rate, testing the hypothesis that Pivot Bio PROVEN® 40 can contribute approximately 30-40 lb N/ac. The Pivot Bio PROVEN® 40 treatment at the reduced N rate yielded the same as the treatment with an additional 30 lb N/ac; however, so did the treatment with reduced N and no Pivot Bio PROVEN® 40 (Figure 2d). There were no statistically significant differences between the treatments evaluated, showing an opportunity to reduce fertilizer application with no yield penalty at this site (Figure 2d).
The curiosity and desire to keep learning is evident. Kottmeyer and the growers he works with plan to keep evaluating the product this upcoming season.
“The research results point to what we learned,” Kottmeyer said. “We’re still going to look at it and continue to ask questions … why we might think we get a response in some spots and maybe we don’t in others. I think we’re still trying to learn.”
Don and Barb Batie: Veteran Insights

Photo by Emily Oestmann for the Nebraska On-Farm Research Network
Don and Barb Batie from Lexington, Nebraska are long-time on-farm research participants with 17 studies conducted over the past five years. Pivot Bio PROVEN® was suggested by one of the retailers Don works with and so he decided he would put it to the test through on-farm research.
Don chose to evaluate Pivot Bio PROVEN® at two different rates, his standard rate of 225 lb N/ac and a 35 lb/ac reduction in N resulting in 190 lb N/ac (Figure 2e). Both rates were tested with and without Pivot Bio PROVEN® applied in-furrow at planting.
“In 2021, the raw look at the numbers showed a slight increase in yield, but by the time it was evaluated with the statistics it didn’t show any difference in yield,” Don Batie said.
While the lack of statistically significant yield differences didn’t point to an advantage for Pivot Bio PROVEN®, the results did reveal an opportunity to save on N fertilizer as the 190 lb N/ac treatment yielded the same as the 225 lb N/ac treatment.
Like Kottmeyer, Batie also plans to continue evaluating Pivot Bio products in 2022. He plans to expand his research to look at how the product performs with even lower N fertilizer rates than the ones used in 2021.
What’s Next?
There are remaining questions about how Pivot Bio performs at various N rates and at what N rate and soil types growers might see the most benefit from a product like Pivot Bio. All studies conducted in the 2021 growing season were conducted on silt loam and silty clay loam soils. More work is needed to determine the impacts in other soils and weather conditions.
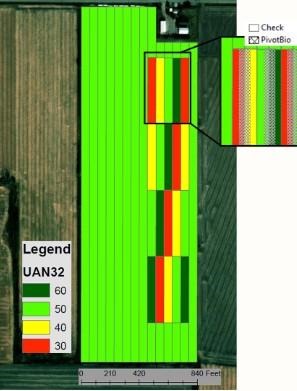
To help answer these questions, some growers — including Batie — have set up trials to look at Pivot Bio on a wide range of N rates in 2022 (Figure 3). These growers put their variable rate fertilizer capabilities to work to create a grid of varying N rates in their field. The field will be planted with a “split-planter” approach such that each rate is split, with half receiving Pivot Bio and half remaining as an untreated check. At harvest, yield monitor data will be collected to determine the impact of the product in each N rate evaluated.

Figure 3. On-farm research trial layout for testing Pivot Bio at multiple N rates.
Is On-Farm Research for You?
This study highlights the benefit of testing products and practices on your own operation through on-farm research.
“Most large corporations spend a portion of their earnings on research, and I think farmers ought to be doing the same, so that’s why I dedicate 10, 20, 50 acres a year to research,” Batie said. “It’s important to do the research in a statistically viable method so you can ensure the results we get are robust. That’s one big advantage using the on-farm research network, we get the statistics to back up what we check.”
On-Farm Research Results
You can see the full results of the Pivot Bio research studies conducted in 2021 in the Nebraska On-Farm Research Network results publication on pages 39 to 44.
Korbin Kudera agreed, noting they participated because “you can’t always trust what a company claims, and whether the product will work, so it’s nice to be able to test it out on your ground to know if it’ll work or not.”
Kottmeyer said he appreciated “help with design of test plots and the statistical analysis.” He also noted how valuable it is when growers around the state do different projects and share their results and data.
There is still time for farmers to start on-farm research studies for the 2022 growing season. Extension educators working with the Nebraska On-Farm Research Network can help you plan your study so you will have confidence in your results. They can also provide opportunities for additional data to be collected on your study, conduct analysis, and summarize and help interpret results.
Are you interested in evaluating Pivot Bio or another product or practice on your farm? The Nebraska On-Farm Research Network can help you set up and evaluate a study on your farm, under your soils and growing conditions. Research plans are available to test Pivot Bio at one N rate or test Pivot Bio at two N rates. Interested in testing another product or practice? View other research project plans here.
Source : unl.edu