Nitrogen Applications on Midwest Farms
Farmers usually make field passes devoted to nitrogen fertilizer applications during at least one of three periods:
Fall: Fall applications of nitrogen typically occur in late fall after the soil temperature has fallen below 50 degrees. The form of this nitrogen typically is anhydrous ammonia. Fall applications include those applied as part of strip tillage, a field operation that tills a strip and may apply nitrogen and other nutrients when the strip is built.
Spring Before Planting: Spring applications occur before planting. Applications typically are in the form of anhydrous ammonia or nitrogen solutions (28% or 32%).
Post plant: Nitrogen applications can occur after planting as either nitrogen solutions or anhydrous ammonia.
In addition to the nitrogen fertilizer passes, nitrogen also is applied as part of other fertilizers or herbicide applications. Typically, these passes include:
Dry fertilizers: Dry fertilizers provide phosphorus and potassium nutrients. Typically, phosphorus is applied as diammonium phosphate (DAP) or monammnium phosphate (MAP), both of which contain nitrogen.
Herbicide Applications: Pre-plant herbicide applications typically include nitrogen solutions as part of the application. Nitrogen solutions increase the effectiveness of the herbicides as well as provide nitrogen to the corn plant.
Data from Precision Conservation Management
This article reports on the nitrogen fertilizer practices of fields enrolled in Precision Conservation Management (PCM). PCM is a farmer service program led by the Illinois Corn Growers Association and Illinois Soybean Association in partnership with over 30 entities, including other commodity associations, conservation groups, private foundations, supply chain providers, the Soil and Water Conservation Districts, and the Natural Resource Conservation Service (NRCS). PCM is an effort to address the goals of the Illinois Nutrient Loss Reduction Strategy. The mission of PCM is to help farmers make decisions about adopting on-farm conservation practices in a financially responsible way. Through PCM’s regional specialists, PCM works one-on-one with over 300 farmers.
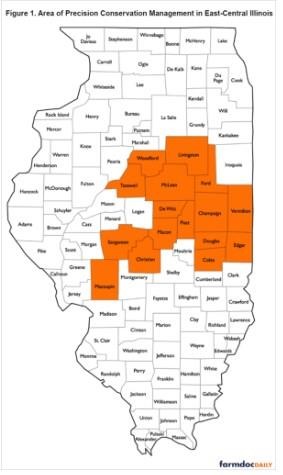
Data in this article comes from sixteen counties in east central Illinois (see Figure 1). Overall, farmland is productive, with corn yields having an average of 224 bushels per acre for fields reported in this article. Over 90% of the fields in PCM follow a corn-soybeans rotation.

The fields in this article apply anhydrous ammonia in the fall. For all fields in PCM, 36% have a fall application in which more than 40% of total nitrogen is applied, implying that 67% of the fields receive most of their nitrogen applications in spring or following planting. On average, there are 25,000 acres summarized in this report. Due to growth in PCM, acres have grown from 9,000 in 2016 to 34,000 in 2021. Average number of fields across all years is 304. Field numbers have grown from 102 in 2016 to 429 in 2021. Field size averages 83 acres.
Nitrogen Applications for Fall Applied Nitrogen
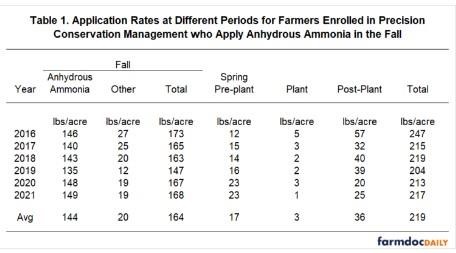
Table 1 shows application rates for farmers that applied nitrogen in the fall. Values are given for each year from 2016 through 2021. Focus first will be given to the average for all years.

On average, 144 pounds of N were applied as anhydrous ammonia in the fall. Given that anhydrous ammonia is 82% nitrogen, the 144 pounds of N application required an average anhydrous ammonia application of 175 pounds. In addition to the 144 pounds of nitrogen from anhydrous ammonia, an additional 20 pounds were applied in the fall. These 20 pounds of nitrogen primarily comes from fall-applied DAP and MAP applications. An average of 164 pounds of N were applied in fall through ammonia and other applications.
Spring pre-plant applications average 17 pounds per acre. Most of these applications were from the inclusion of nitrogen solution in herbicide applications. A small number of fields also applied DAP and MAP in the spring.
An average of 3 pounds of nitrogen were applied at planting. A small number of fields put nitrogen on at spring planting. ‘
On post-plant applications, 36 pounds of nitrogen were applied on average. However, the pounds of post-plant varied across farms. In 2021, 60% of the fields received some form of post-plant application, while 40% did not receive any application.
There is some variability in average rates across the years. Rates declined from a total N of 247 pounds in 2016 to 215 in 2017. The lowest total rate was 204 pounds per acre in 2019, the year of heavy rainfall and late corn planting.
University recommendations from the Corn Nitrogen Rate Calculator are given as Maximum Return to Nitrogen (MRTNs). Those recommendations range by year, depending on the relative prices of corn and nitrogen. Moreover, each year MRTNs are updated as additional data enter the calculators. For corn-after-soybean, MRTNs were 168 pounds per acre in 2016, 172 pounds in 2017, 176 in 2018, 173 in 2019, and 184 in 2020.
For PCM farms, the average of total nitrogen applications were above MRTNs. Average nitrogen applications in the fall were near the MRTNs.
Variability and Profitability
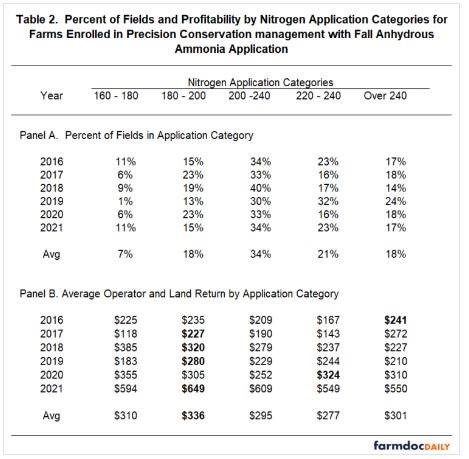
Averages in Table 1 mask variability across fields. Panel A of Table 2 shows the percent of fields in application ranges. On average, 7% of the fields received a total rate between 160 and 180 pounds of nitrogen per acre, and 18% received applications between 180 and 200 pounds per acre. These two ranges contain 25% of the fields. MRTNs fell in these two ranges. The next three ranges were above the MRTN: 34% were from 200 to 220 pounds, 21% from 220 to 240 pounds, and 18% were over 240 pounds. The three higher ranges included 73% of the fields. Two percent of fields had applications below 160 pounds.

Operator and land return is a measure of profitability. Panel B of Table 2 shows operator and land returns by application range categories. Average returns were $310 for the 160 to 180-pound category and $336 per acre for the 180 to 200-pound category. Average returns were lower for the higher application rate categories above the MRTNs: $295 per acre for 200 to 220 pounds per acre, $277 for the 220 to 240-pound range, and $301 for the over 240-pound category.
Overall, there were minor increases in yields for higher application rates in some years. Nitrogen fertilizer costs, however, increased with more applications rates. Each 20 pound of actual nitrogen requires 24 additional pounds of anhydrous ammonia. At $750 per ton for ammonia, 24 additional pounds adds $9 per acre in costs. Additional field passes will increase costs more.
Overall, the above returns suggest that the university recommended MRTNs maximize returns from nitrogen.
Post-Plant Applications
We divided fields into two groups to evaluate the profitability of applying nitrogen post-plant given a fall application of anhydrous ammonia. The two groups were
- Post-plant applications included 60% of fields receiving post-plant nitrogen.
- No-post-plant application fields that did not receive nitrogen post-plant.
The two groups had roughly the same operator and land return: $289 per acre for post-plant applications compared to $289 per acre for no-post-plant. Overall, fields with post applications had slightly higher yields: 217 bushels per acre for post-plant applications compared to 213 with no-post-plant. Additional costs exist for post-applications, including 1) the costs of the post-plant nitrogen pass and 2) switching nitrogen forms. Most post applications are made with nitrogen solutions which have higher costs per pound of nitrogen compared to anhydrous ammonia.
In making this comparison, both post-applied nitrogen fields and those that did not receive post-applications had nitrogen applications above MRTNs: 220-pound average post-application fields compared to 216 pounds for fields with no-post-plant Results could have differed for the two groups had applications been closer to MRTNs.
Summary
On average, fields in PCM that received fall-applied anhydrous ammonia had higher returns when nitrogen application rates were near MRTNs. We did not find higher profitability for fields that applied nitrogen after planting, perhaps because nitrogen was well above MRTNs for both sets of fields that received and did not receive post-plant applications.
Source : illinois.edu