By Ashley Hungerford, Shawn Arita.et.al
2019 has been a turbulent year. Unprecedented rains during spring, which led to heavy flooding and disrupted corn planting in many states, created a forecasting environment more challenging than usual. When USDA’s August report delivered much higher than expected production estimates, it resulted in a great deal of questions. Many were shocked by the 90 million planted acres for corn that had been forecasted by NASS, particularly when juxtaposed with the over 11 million corn acres of prevent plant reported by FSA. Further, many others had felt that yield estimates were too high. This article sheds some light on the different sources of data USDA has for estimating corn production. It builds on an earlier report published on the USDA-Office of the Chief Economist website available here.
Background
The cool and wet conditions this spring resulted in the slowest corn planting progress since USDA started recording planting progress in 1980. That weather and delayed planting progress led to market and analyst expectations of low 2019 corn acreage and yields. The December CME corn futures contract spiked to over $4.50 per bushel by the end of May. On June 11, USDA’s World Agricultural Outlook Board (WAOB) lowered the World Agricultural Supply and Demand Estimates (June WASDE) projected corn yields from trend expectations of 176 bushels per acre to 166 bushels per acre and lowered projected harvested acreage from 85.4 million acres to 82.4 million acres due to “…unprecedented planting delays observed through early June…” (see here). Estimated planted acres fell from 92.8 million acres to 89.8 million acres.
Beginning in early June, the USDA National Agricultural Statistics Service (NASS) surveyed producers and asked what they planted or intended to plant. For the week ending June 9, only 83% of the corn crop had been planted, a historic low and far below the historical 5-year average of 99%. At that time the market signals were to plant corn and not soybeans if possible and so many producers notified their intention to plant corn. Following news of the heavy flooding in the Midwest, markets anticipated a major shortfall in corn while soybean prices continued to face pressure from large carry-over stocks. That led the soybean-corn price ratio to fall from 2.4 in March to 2.0 by early June. Critically, this reduction in relative prices occurred during planting season, providing a signal to plant corn instead of soybeans, even though the actual size of the crop was still unknown and speculative.
On June 28, NASS reported estimated corn harvested acres at 83.6 million acres (estimated planted acres totaled 91.7 million acres, below the NASS March Prospective Planting estimate but higher than the 89.8 million acres estimated by WAOB in the June WASDE). On July 11, WAOB revised its corn crop production estimate upwards in the July WASDE to reflect the NASS acreage estimates but did not change its yield estimates for corn. Total production was estimated at 13.875 million bushels up from June’s estimate at 13.680 million bushels.
Given the large number of unplanted acres encountered in the NASS June Acreage survey, NASS indicated that it would re-survey 14 major corn-producing states in July and release the updated acreage estimate as part of the August Crop Production report (see here). Similar resurveying efforts due to planting delays occurred in 2013 and 2015 (NASS, 2013; NASS, 2015). On August 12, WAOB incorporated into the August WASDE the new corn production estimates from the August NASS Crop Production report which was updated based on the acreage resurvey. The new estimate placed the corn crop at 13.901 million bushels, based on slightly higher yields, but lower harvested acres compared to the July estimates.
August Reports
While there is less data available for the June and July crop production estimates, there is more information available on acres and yields beginning in August. Farmers participating in certain farm programs[1] are normally required to certify acres planted and the intended use of the crop to their local Farm Service Agency (FSA) county office by July 15. That information is compiled and reported to the public monthly at the county level starting in August. On August 12, FSA released their reported acreage as of August 1, 2019.
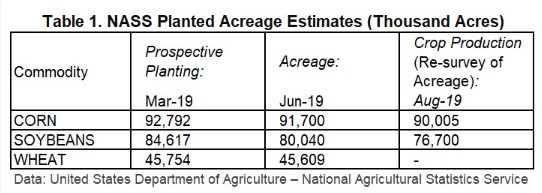
NASS received the FSA data on a continuous basis before and after they estimated crop production on August 12. In addition, NASS had new farmer survey data and satellite imagery, which led them to revise their corn harvested acres down from 83.6 million acres to 82.0 million acres and planted acreage down from 91.7 million acres to 90.0 million acres. Table 1 shows the decline in both corn and soybean planted acreage from the March Prospective Plantings to the August Crop Production. Notably, soybean acreage experienced a much more precipitous fall compared to corn: a decline of 7.9 million acres vs. 2.8 million acres from the March Prospective Plantings. Also noteworthy, the planted acreage for the eight major row crops[2] fell by 15.1 million acres, from 253.9 million acres in 2018 to 238.8 million acres in 2019.
Despite the downward revision, the August planted acreage estimate from NASS exceeded all market expectations. Many viewed the 90.0 million planted acres forecast as the biggest surprise in the August Crop Production report. The trade had been expecting planted acres in the range of 83 to 89 million acres. USDA’s estimates surprised traders and growers who expected rain-delayed planting to weigh more heavily on its corn outlook, after re-surveying producers and studying satellite imagery in July (Parker, Hirtzer, and Almeida, 2019).
One reason was that the FSA certified acres report showed that as of August 1, 85.9 million acres had been planted to corn and that an additional 11.2 million acres had been prevented from being planted to corn. Many external commentators viewed the NASS survey estimates and the FSA reported planted acres and prevent plant acres for corn as being inconsistent.
Why do FSA and NASS planted acreage differ?
First, these data sources are intended for different purposes. FSA data is used for implementing certain FSA programs, while NASS survey data is used for estimating planted acres and harvested acres. That explains why these data are difficult to compare directly.
For example, the FSA certified acreage by crop does not include acreage planted as a cover crop. Any cover crop acreage, such as corn silage planted as cover, will be reported to FSA simply as “cover crop” not “corn”. However, NASS will record this cover crop acreage under the planted acreage for corn. In addition, NASS planted acreage includes acreage not enrolled in farm programs; whereas FSA certified acres will generally be from farmers participating in farm programs.
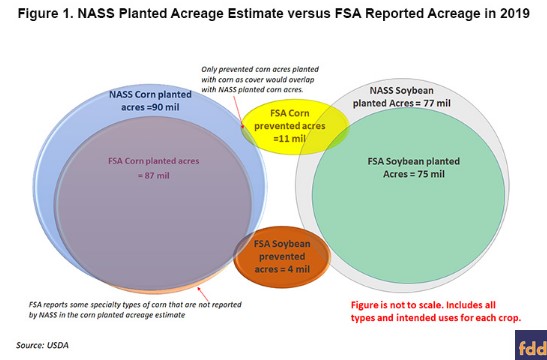
Figure 1 summarizes, visually, the hazards of combining NASS and FSA acres, and planted and prevented acres. Due to program participation, FSA-reported planted acreage is a subset of NASS total acreage (with the exception of specialty-type corn) and thus not directly comparable to FSA planted acres. More critically though is the layer of overlap between reported prevented and planted acres. Since these values are not mutually exclusive, the simple summation of total prevented and total planted acres would overestimate the actual total national acreage in 2019. This is the key source of confusion in interpreting the different reporting sources for acreage numbers.
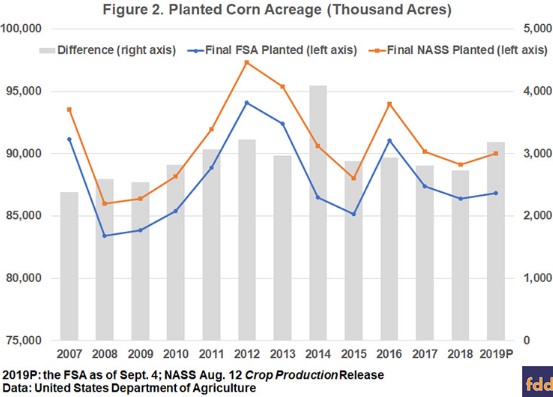
Those factors result in an average 2.9 million acre difference between the NASS planted acreage estimate and FSA reported planted acres, as shown in Figure 2. The largest difference between NASS and FSA planted acres occurred in 2014, when NASS planted corn acreage was 4.1 million acres higher than the planted corn acreage reported to FSA. As of September 4, FSA planted corn acreage is 3.2 million acres lower than the NASS planted acreage estimate, which is within the normal range over the past ten years.
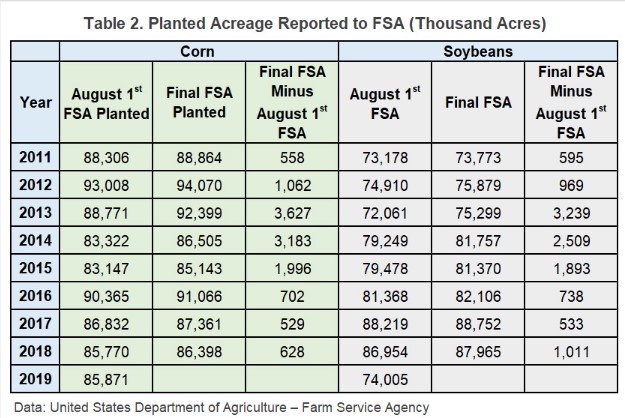
The certified acres reported by FSA from county offices takes time to compile and complete. As result, the August 1 certified acres will lag behind the final FSA planted acre report, usually finalized in January of the following year. Since August 1, planted corn acreage reported to the FSA, not including corn grown as cover crop, has grown by nearly a million acres. As of September 4, FSA reported planted acreage for corn across all types and intended uses, excluding cover crop, is 86.8 million acres. This is normal– every year acreage reported to FSA consistently increases after August 1, as shown in table 2. For example, in 2013, corn and soybean reported acreage increased by over 3 million acres between August 1 2013 and the final reported acreage release in January 2014. While the acreage reporting deadline to FSA is generally July 15 for spring-seeded crops, in 2019 due to flooding and heavy moisture, the acreage reporting deadline was extended to July 22 for producers in Arkansas, Illinois, Indiana, Iowa, Kentucky, Michigan, Missouri, Minnesota, North Dakota, Ohio, Tennessee and Wisconsin. The wet conditions earlier this year may cause more late-reported acres than usual.
What about the prevented planted acreage?
In addition to concerns about the difference between FSA and NASS acreage, there remain questions about the sum of prevented acreage and planted acreage. FSA prevented acreage reflects the number of acres that farmers intended to be planted for a particular crop but did not plant to the crop. Suppose a farmer intends to plant 1,500 acres of corn but is unable to plant the acreage with corn. Instead on the same acreage, the farmer plants 300 acres of soybeans for harvest and 1,200 acres of oats for cover crop. FSA will report the acreage as 1,500 prevented acres of corn, 300 planted acres of soybeans, and 1,200 acres of cover crop. Any acreage reported to FSA as a cover crop is reported as “cover crop” with specific crop types of “brassicas and other broadleaves”, “cereals and other grasses”, “legumes”, or “mixtures”. The oats planted by the farmer as a cover crop would be categorized as “cover crop” in the “crop” category —not “oats”—and be listed as a “cereal and other grasses” under “crop type”. This example shows that planted acres and prevented acres are not mutually exclusive.
Because the same acreage can be prevented for one crop and planted to another, in the example above, the sum of the prevented acres and planted acres across the different crops is 3,000 acres despite the farmer only having 1,500 acres. Since the publicly available FSA data does not provide the overlap between planted and prevented acreage, the sum of planted and prevented acreage across different crops is generally uninformative.
Table 3 compares the final FSA reported acreage for 2018 and the 2019 FSA reported acreage as of September 4, 2019. The acreage below excludes the intended uses of forage, grazing, silage, or left standing. These uses were removed to make 2018 and 2019 directly comparable since dual-use small grains are double counted in 2019 reported data and not 2018 reported data. In 2019, planted acreage is down by 15.3 million acres across the eight major crops while prevented acres increased by 17.6 million acres compared to 2018. The planted acreage does not include 5.0 million acres planted to cover crop in 2019, up from 2.2 million acres in 2018.
What about the yields?
Additionally, many in the ag industry believed that the estimated yields in the August Crop Production were too high (and remain too high), with the August yield estimated at 169.5 bushel per acre for corn, up from the July estimates of 166 bushel per acre. While that was down from trend, it was still higher than the July WASDE estimate of 166.0 bushels per acre. The Agricultural Yield Survey (AYS) was used to develop the August estimates, which is based on farmer reported expected yields. The AYS across all field crops surveyed 20,837 farmers for the August Crop Production and another 9,624 farmers for the September Crop Production.
In September, NASS used both the AYS and the Objective Yield Survey (OYS). For corn, the purpose of the OYS is to measure number of ears per acre and average ear weight. In the early stages (Stage I: No Ears Shoots– Stage IV: Milk), number of ears per acre is estimated by stalks or stalks with ears/ear shoots, and in later stages (Stage V: Dough – Stage VII: Mature), actual ears with kernel formation are used. To estimate the average ear weight, when ears are formed at Stages III and Stage IV, the length of the kernel row and diameter of the ear are measured. At the later stages, the weight of the ears is measured as well to form the estimate of average ear weight (NASS, 2019).
The September yield estimate declined from the August estimate of 169.5 bushel per acre to 168.2 bushels per acre. From 1990 to 2018, the average absolute difference between the August and September yield estimate for corn has been ±1.9 bushels per acre with a standard deviation of 1.5 bushels per acre. Hence the change in the September yield fell within the historical norm. Figure 3 shows the variation between August and September forecast for corn, with the largest change occurring in 2011 (September being 4.9 bushels lower than August).
Summary
Based on the NASS acreage and yield estimates, the August WASDE corn production was estimated at 13.9 billion bushels, while trade expectations ranged from roughly 12.7 billion bushels to 13.6 billion bushels. While the August Crop Production estimates defied trade expectations, the most recent certified acreage data from FSA showing nearly 87 million planted corn acres supports the NASS August estimate of 90.0 million acres, given the historical relationship between farms reporting acres to FSA and those surveyed by NASS. Further, despite the September Crop Production showing lower yields for corn, the yield is still relatively close to the August Crop Production, and once again, within historical norms.
Nevertheless, the larger-than-expected crop size forecasted in recent USDA crop reports were met with ‘disbelief’ by some (see farmdoc daily, August, 19, 2019). Given those reactions, it is also interesting to ask how the markets, which reflects actual trading positions of buyers and sellers, responded to those reports. Was the market reaction consistent with historical behavior? Did traders express more uncertainty about the commodity outlook? Did the report generate abnormal market volatility? An accompanying article will take stock of available futures, options, and cash market price data and examine whether the markets displayed signs of ‘disbelief’ to recent USDA crop forecast.