Results are presented from a simulation study parametrized to represent a wide variety of possible yields and prices for 2022. Those yield and price combinations are simulated based on historical yields, prices, and correlations between yields and prices. A starting point for the analysis is the estimated 2022 projected price of $5.70 per bushel.
The case study will be a McLean County farm growing corn. The case farm is similar to that used to forecast returns from alternative leasing arrangements (farmdoc daily, February 8, 2022) and evaluate crop insurance decisions (farmdoc daily, February 1, 2022). The basics of the situation are:
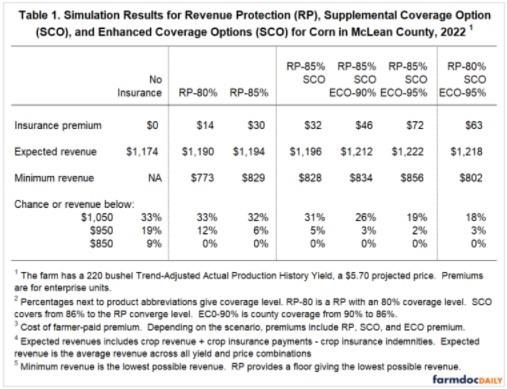
- Trend-Adjusted Actual Production History (TA-APH) yield is 220 bushels per acre.
- The projected price for crop insurance is $5.70 per bushel. The 2022 price is not known with certainty at this point, but $5.70 is a good estimate given current futures price levels.
- The volatility for determining crop insurance premiums is .23, also an estimate.
- Crop insurance is purchased for enterprise units. An enterprise unit covers all acres of one crop in a county. It has a lower premium than basic and optional units.
Non-land costs for 2022 are projected at $755 per acre. Cash rents likely will average $310 per acre, giving $1,065 in total costs. In the following analysis, we will examine the chance of revenue being below the following levels:
- $1,050 — roughly a break-even at an average cash rent,
- $950 — a lower level representing over a $100 loss per acre, and
- $850 — a sizeable loss that would result in serious financial stress.
Table 1 shows results for seven cases:
- No insurance is the baseline and shows how crop insurance lowers risk.
- RP-80%. RP at the 80% coverage level is the second most common plan and coverage used in Central Illinois. As a result, many farmers choose between RP-80% and RP-85%.
- RP-85%. RP at the 85% coverage level is the most common plan and coverage used in central Illinois. Premium cost being an important component of the decision between RP-80% and RP-85%.
- RP-85% + SCO. This package includes an RP-85% plan and Supplemental Coverage Option (SCO). SCO provides county-level coverage from 86% to the coverage levels of the RP policy (85% in this case).
- RP-85% + SCO + ECO-90%. ECO provides county protection from 90% to 86%. The ECO and SCO combination provides county coverage from 90% to 85% where the RP-85% coverage begins through a combination of SCO (86% to 85%) and ECO (90% to 86%).
- RP-85% + SCO + ECO-95%. This package provides county coverage from 95% to 85% where the RP-85% coverage begins through a combination of SCO (86% to 85%) and ECO (95% to 86%).
- RP-80% + SCO + ECO-95%. This package provides county coverage from 95% to 80% where the RP-80% coverage begins through a combination of SCO (86% to 80%) and ECO (95% to 86%). Some farmers consider purchasing RP at a lower coverage level and then using the SCO/ECO to provide additional county level insurance above the lower individual coverage level.
Results in Table 1 use ECO and SCO at the highest protection level. Lowering the protection level will lower premiums and payments by the same proportional magnitude.
No Insurance
The expected revenue is $1,174 per acre. The expected revenue is the average of all crop revenue plus crop insurance payments less crop insurance premiums. For the no insurance case, crop insurance payments and premiums always equal zero, and expected revenue is all crop revenue. Expected crop revenue of $1,174 is $109 per acre higher than projected costs of $1,065. Overall, profitability is expected.
The no insurance case does not have a minimum revenue. Conceivably, the farm could have a zero yield and no crop revenue. Those situations would be extremely rare, not likely to be observed during the lifetime of the vast majority of farmers.
The probability of revenue being below $1,050 is a measure of risk. The $1,050 revenue level is close to the $1,060 per acre of costs. As a result, this benchmark gives the chance of losses. Without insurance, the historically observed price and yield changes indicate probability of being below $1,050 is 33% or one in three years, a significant probability.
Also given are probabilities of being below $950 and $850 per acre, worse for a farmer. Under no insurance, there is a 19% chance of being below $950 per acre, roughly a one in five-year event. The chance of being below $850 is 9%, approximately a one in ten-year event.
Revenue Protection
RP premiums are $14 per acre at the 80% coverage level and $30 per acre at the 85% level. These are farmer-paid premiums based on enterprise units.
Expected revenue under RP goes up compared to the no insurance case. RP-80% has an expected return of $1,190 per acre, compared to $1,174 for the no insurance case. Expected revenue increases to $1,194 with RP-85%. Expected revenue increases occur because the RP policy is Federally subsidized. These subsidies result in premiums being less the average crop insurance payments over time. Note that increases in expected revenue do not mean that farmers receive payments from crop insurance every year. Insurance will pay in certain years, with the majority of payments coming in adverse years, such as the 2012 drought.
Minimum revenue is $773 per acre under RP-80% and $829 per acre at RP-85%. Both products put a floor under revenue.
The chance of revenue being below $1,050 stays the same at 33% with RP-80%. Use of RP-85% lowers the chance of losses to 32%, a slight decrease.
Overall, RP has little impact on probabilities at the $1,050 revenue level. However, probabilities are lowered significantly for the $950 and $850 revenue levels. For example, the chance of being below $850 is 9% for no insurance, 1% for RP-80%, and 0% for RP-85%. RP eliminates the chance of having revenues below $850.
RP at high coverage levels reduces downside revenue risks. Because of risk subsidies, RP reduces these risks without much reduction in expected revenue.
SCO and ECO
Given their high coverage levels, SCO and ECO may have an impact at higher revenue levels than RP.
When combined with RP-85%, SCO provides county coverage from 86% to 85% — a limited range — and has a $2 per acre premium. When combined with a RP-55% policy providing country coverage from 86% to 55%, farmer-paid premium totals $32 per acre. Expected revenue with SCO increases to $1,196, from $1,194 with PR-85% alone. SCO premiums are also Federally subsidized, resulting in an increase in expected revenue. Because of its limited range, SCO does not significantly reduce the probability of being below $1,050. For RP-85% with SCO the probability is 31% compared to 32% with RP-85% alone. When paired with RP-85%, SCO has limited additional impacts on downside revenue risk.
ECO at the 90% has a $14 per acre premium. Combined with RP—85% and SCO, total farmer-paid premium equals $46 per acre. ECO provides county protection from 90% to 86%, a more extended range than SCO covers when paired with RP-85%. Expected revenue increases to $1,212 because ECO is Federally subsidized. ECO increases the expected return by $18 per acre. The chance of being below $1,050 is reduced to 26%, a significant reduction from 32% with just RP-85%. Overall, ECO-90% does reduce downside risk and increases expected returns. However, premiums are $14 per acre, a significant increase in premium cost.
ECO at 95% has a $40 per acre premium. The range from 95% to 86% will often trigger a payment, causing the large premium. The combination of RP-85%, SCO, and ECO-95% has total farmer-paid premium of $72 per acre. Expected revenue with ECO-95% increases to $1,222, with the increase due to Federal subsidies. An ECO-95% policy increases the expected return by $10 per acre. The chance of revenue below $1,050 is reduced to 19%.
ECO-95% used in conjunction with RP-95% and SCO will reduce risk and increase expected return. However, the premium costs are high, totaling $72 per acre. The expected profit from corn production without crop insurance is $114 per acre ($1,174 expected revenue – $1,050 total costs). In years when insurance payments are not triggered, the use of RP-85% with SCO and ECO-95% will reduce this profit by 63% to $42 per acre. The premium costs will significantly reduce income in many situations in which crop insurance payments are limited.
ECO and Reductions of Coverage Levels
The final scenario shows the case of RP-80% with SCO and ECO-95%. Some farmers may consider reducing the underlying RP policy to save on premiums. In this case, SCO provides coverage from 86% to 80%. A comparison of this same package with RP-85% suggests
- RP-85% has lower premium costs: $30 per acre compared to $63 per acre for RP-80%, SCO, and ECO-95%.
- RP-85% has lower expected revenue: $1,194 to $1,218.
- RP-85% has less risk reduction at the $1,050 revenue level.: 32% compared to 18%.
Summary
ECO has several merits. The use of ECO will increase expected revenues and reduce downside risk. However, ECO has high premium costs. Those high premiums will reduce profits in years in which crop insurance payments are limited. The decision to use ECO is an individual one, weighing the costs of the policy with its potential benefits.
Source : illinois.edu