Figure 1: A map of Ohio with counties highlighted where Fall 2020 pipeline sampling occurred.
In preliminary findings, Ohio crop yields follow similar patterns to previous studies when pipelines are installed. On average, corn grain yields decreased an average of 23.8%, silage corn decreased an average of 28.8%, and soybean yield decreased an average of 7.4% over the pipeline compared with adjacent areas. Figure 2 shows yield data with each point representing a different field. Negative values to the left of dashed red line indicate percent yield reductions over the pipeline relative to the non-impacted area. Soils within the ROW had more rock fragments, lower soil moisture, and had a higher resistance to penetration which indicates lasting forms of soil compaction.
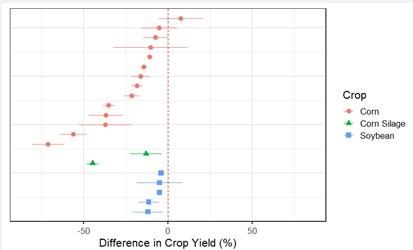
Figure 2: Percent difference in crop yield for corn grain, corn silage, and soybean along Right-of-Way compared to adjacent, undisturbed areas of the field.
Source : osu.edu