Other significant differences include:
- House permits one coverage decision over the farm bill’s life, Senate retains annual decision;
- House, not Senate, allows LGM-Dairy insurance for milk not covered by MPP-Dairy; and
- House, not Senate, adjusts feed cost formula—House directs NASS to collect for 5 top milk states the price of high-quality alfalfa (considered a more accurate measure of hay cost for high yield cows).
Historic Margins
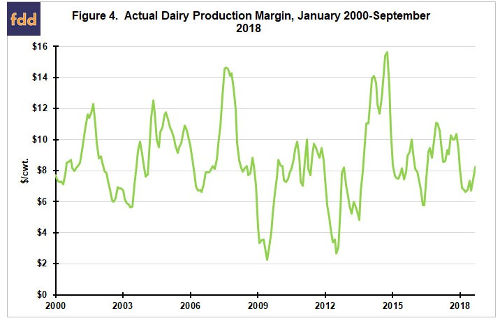
It is always tenuous to project future payments by a program from history. In addition, payments from a new program may alter supply response, particularly if its payments are large enough to keep financially-stressed farms from exiting. Nevertheless, historical size and pattern of the Actual Dairy Production Margin (ADPM)—Dairy-MPP version of income over feed cost—is a useful and reasonable starting point for understanding potential payments.
ADPM is estimated on a monthly basis since 2000 (see Figure 4). ADPM has averaged $8.57/cwt. with a standard deviation of $2.49/cwt. Since 2000, ADPM was less than $8.00/cwt., $8.50/cwt., and $9.00/cwt. in 43%, 53%, and 62% of the months. Adding the new margins thus is potentially a nontrivial change in MPP-Dairy policy.
Historic Payments
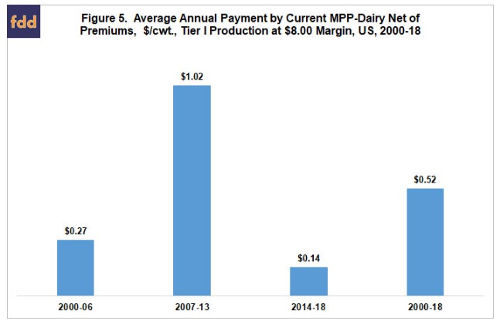
Tier II protection is not available at $8.50 or $9.00/cwt. margins. Moreover, its premiums is over $1/cwt. higher than premiums for Tier I protection at the $8.00 margin, making it an undesirable option in most years. Tier I is thus our focus. Unsurprisingly given Figure 4, average annual net MPP-Dairy Tier I payments are period dependent. For the current MPP-Dairy version, average payment net of producer-paid premiums for the $8.00 margin varies from $0.27/cwt. per year for 2000-06 to $1.02 per year for 2007-13 to $0.14/cwt per year for 2014-18 (see Figure 5). The size of this range underscores the importance of the distribution used to estimate future payments by MPP-Dairy.
In the discussion that follows 2014-18 is used as the comparison period. It is the latest period, does not include the period of high crop prices which appear unlikely to be repeated in the near future, and is a period over which MPP-Dairy existed.
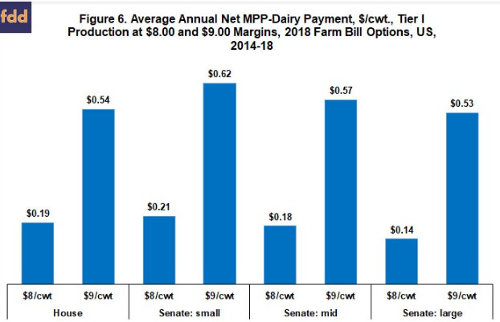
For 2014-18, the discounts proposed by the Senate increase average annual payment for small and medium dairy farms by $0.07/cwt. and $0.06/cwt., respectively, relative to large dairy farms (see Figure 6). By comparison, raising the highest margin from $8.00/cwt. to $9.00/cwt. roughly tripled average payment per cwt. on Tier I production (see Figure 6). Average payments at the $9.00 margin are similar for the House version and for large dairy farms in the Senate version.
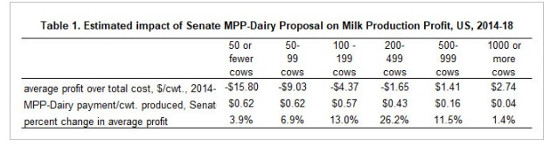
Financial stress of dairy farms has attracted considerable attention the past year. It is likely one of the reasons that the changes made to MPP-Dairy in early 2018 effectively guaranteed a payment at signup. A second key current economic feature of the US dairy sector is strong economies of size (see Zulauf, farmdoc daily May 25, 2017 and August 17, 2017). Table 1 therefore compares average annual payment by the Senate proposal on MPP-Dairy at the $9.00/cwt margin for 2014-18 to average profit above total cost by dairy farm size as reported by USDA, ERS (U.S. Department of Agriculture, Economic Research Service). Data for the latter variable exist for 2014-17 but not 2018. Thus, the two variables cover different periods. While this difference needs to be kept in mind, the comparison is reasonable and involves the latest available data. Impact is measured as the percent change in profit or loss (see Data Note). The Senate proposal most impacts profitability of farms with 100 to 1000 cows, especially 200-499 cow farms. It impacts small farms more than large farms. MPP-Dairy payments are not large enough to turn a loss into a profit for any farm size. It is worth noting that considerable controversy surrounds the measurement of cost on dairy farms, especially on small farms. Thus, these conclusions may be dependent on the data set chosen to measure cost and return.
Summary Observations
- Dairy policy has been a cornerstone US farm policy issue of 2018.
- Changes enacted in the Bipartisan Budget Act of February 2018 and proposed in the House and Senate Farm Bills (subsequently shortened to 2018 dairy policy changes) confirm a strong commitment to the policy path laid out when MPP-Dairy was created in the 2014 Farm Bill.
- 2018 dairy policy changes are clearly designed to increase average payments by MPP-Dairy, mostly by the addition of $8.50/cwt. and $9.00/cwt. margin protection levels.
- 2018 dairy policy changes appear to benefit mid-size dairy farms the most as measured by the percent increase in profit or percent reduction in loss.
- 2018 dairy policy changes help small dairy farms more than large dairy farms, again as measured by percent increase in profit or percent reduction in loss.
- 2018 dairy policy changes do not appear to alter the economies of size forces at work in the US dairy sector. For example, no farm size has its loss turned into a profit.
- Economies of size forces will continue to press dairy farms to get larger or differentiate out of commodity milk production.
- 2018 dairy policy changes leave open the question of whether US dairy policy should have a component designed to address the sustainability problems of small dairy farms, for example by facilitating local or artisan markets or by facilitating co-ops specifically designed for small dairy producers in these markets.
Data Note
Base year used to calculate milk cost of production was changed from 2010 to 2016 with the 2016 report. At the same time USDA, ERS split the 1000-or-more-cow category into 1000-1999 cows and 2000 or more cows. To maintain consistency, return above total cost is calculated for a 1000 or more cow category. Net return reported for the two new categories is weighted by their respective share of average annual milk production per farm calculated using the average number of cows and production per cow reported in the cost of production data for the two categories. Net MPP-Dairy payment per cwt. for a size category was determined using average milk production in the 2010 base year for a category (average number of cows times average output per cow). The 2010 values are 507,045 pounds/year for fewer than 50 cows, 1,165,316 pounds/year for 50-99 cows, 2,555,145 pounds/year for 100-199 cows, 6,190,704 pounds/year for 200-499 cows, 15,760,142 pounds/year for 500-999 cows, and 52,016,160 pounds/year for 1,000 or more cows. 2016 production values were used to calculate MPP-Dairy payments per pound of milk produced for the categories of farm size that produced more milk than the Tier I cap of 5,000,000 pounds. 2016 production values by category are 522,206 pounds/year for fewer than 50 cows, 1,211,896 pounds/year for 50-99 cows, 2,643,976 pounds/year for 100-199 cows, 6,670,824 pounds/year for 200-499 cows, 16,230,760 pounds/year for 500-999 cows, and 69,365,869 pounds/year for 1,000 or more cows.
Source: farmdocdaily