Evapotranspiration (ET) includes two terms: evaporation (E) from the soil surface and transpiration (T) from the leaves. It is very difficult to estimate or measure these two components independently, so they are often calculated and measured together. Over a growing season, 70% to 80% of all ET is used up as transpiration and remaining 20% to 30% of ET is direct evaporation from the soil.
For transpiration, water moves from the soil through the crop’s root system and comes out from the leaves. The process of transpiration is essential for cooling the leaves and it also facilitates the movement of nutrients from the soil into the plant, thus directly influencing the grain production. As the crop grows, the canopy covers or shades the soil surface, which reduces the evaporation from the soil as we move into the growing season. By the mid-season, leaf area is sufficient to cover the soil surface to the maximum. At that time, transpiration becomes the dominant component.
What are different factors that affect ET?
Crop type and growth stage
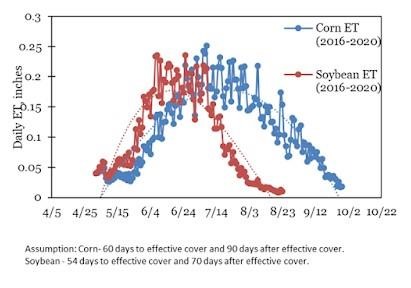 |
Figure 1. Average (2016-2020) crop water use rates for
corn and soybean at Becker, MN. |
The crop type, variety and development stage of the crop affects ET in crops grown in large, well-managed fields. Differences in crop height, ground cover and crop rooting characteristics result in different ET levels in different types of crops under identical environmental conditions.
As an example, a seasonal water use curve for corn and soybean for Becker, MN is shown in Figure 1. The maximum crop water use for both crops occurs close to the end of vegetative growth and start of reproductive growth stage. For corn, at the beginning of the dent stage and for soybean, at pod fill, the ET starts declining, even though the crops is at full cover.
Weather
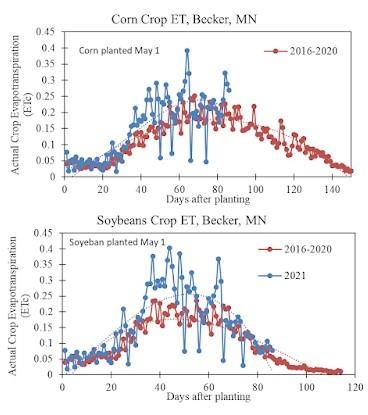 |
Figure 2. Comparison of average (2016-2020) growing
season ET with 2021 growing season ET for corn and
soybean. Assumes full cover at 60 and 54 days after
planting for corn and soybeans, respectively. |
The principle weather parameters affecting ET are solar radiation, air temperature, relative humidity, and wind. If the temperatures are high, humidity is low and winds are high, ET demands increase. In Figure 2, the average (2016-2020) ET is compared to the 2021 growing season ET. With high temperatures in 2021, the ET for both corn and soybean in the month of June and July was higher than the average ET.
These graphs indicate that depending on long-term average values of ET for irrigation scheduling is not appropriate, particularly for years like 2021. The long-term average provides a rough approximation of actual crop water use; however, irrigation scheduling is more accurate when daily ET values from weather data are used.
Water holding capacity of the soil
Water holding capacity is the maximum amount of water that soil can store to be extracted by the plants. It is the water held between field capacity and permanent wilting point. The total available water in the soil root zone for a specific crop is equal to the crop’s rooting depth multiplied by the available water-holding capacity per unit depth of the soil.
Different soil types have different water holding capacities. For example, coarse soils, such as sands and sandy loam, have relatively large pores when compared to a finer textured soil such as clay. Fine soils, like clays or clay loams, have small mineral particles and very small pores. Having a larger number of small pores means that a fine textured soil can hold more water than a coarse textured soil. When the soil profile is at field capacity, plants use water at the maximum rate. As the water content of the soil drops, plants are less able to extract the water.
Residue cover
The residue cover has a significant impact on the evaporation of water from the soil surface. Tillage increases the exposed surface area of the soil, which increases evaporation and runoff, and may reduce water infiltration because of compaction in the tillage process. Through research, it has been found that the plots with residue on the soil surface could save 3-4 inches of irrigation as compared to bare soil (University of Nebraska).
How do I calculate ET?
Crop Evapotranspiration (ETc) can be estimated using a two-step approach to determine the crop-specific water use (ETc) as per the following equation:
ETc = ETref x Kc (Equation 3)
Where ETref is the reference evapotranspiration - which is the evapotranspiration from a reference crop (grass or alfalfa) - and Kc is the crop coefficient. Kc varies by crop development stage. Crop coefficient values for corn and soybean are presented in Table 1. The Kc values for other common crops grown in Minnesota can be found at https://extension.umn.edu/irrigation/evapotranspiration-based-irrigation-scheduling-or-water-balance-method
Table 1. Mean crop coefficients (Kc) for corn and soybean in Minnesota for use with alfalfa reference ET.
| Days after planting | Corn | Soybean |
|---|
| 10 | 0.19 | 0.23 |
| 20 | 0.22 | 0.33 |
| 30 | 0.33 | 0.53 |
| 40 | 0.53 | 0.77 |
| 50 | 0.79 | 0.94 |
| 60 | 1.00 | 0.97 |
| 70 | 0.99 | 0.89 |
| 80 | 0.97 | 0.59 |
| 90 | 0.94 | 0.29 |
| 100 | 0.89 | 0.14 |
| 110 | 0.82 | 0.09 |
| 120 | 0.72 | 0.06 |
| 130 | 0.58 | |
| 140 | 0.40 | |
| 150 | 0.17 | |
Kc numbers are adapted from ASCE manual 70 and were adjusted based on the following assumption: Assumes full cover at 60 and 54 days after planting for corn, and beans respectively.
Alfalfa-reference and grass-reference evapotranspiration (ETref) are calculated using the standardized Penman-Monteith equation. Climate variables measured by a weather station are used as input data to calculate ETref. Climatic data included are air temperatures, solar radiation, humidity and wind.
Tools for reference ET:
- Central MN and Dakota County weather stations
- UW Ag weather for southeast MN
When to stop irrigating?
Determining the amount and timing of the last few irrigations of the season is one of the most critical water management decisions. Discontinuing too early in the season to save water or reduce pumping costs could mean a much greater reduction in yield returns than the cost of pumping. On the other hand, irrigating right up to crop maturity may mean using 1 to 3 inches more irrigation water than necessary.
The two basic irrigation water management strategies that an operator should keep in mind when predicting the last irrigation are:
- To provide adequate soil moisture in the root zone to carry the crop to maturity without reducing yields.
- To deplete the soil moisture farther than normal (i.e., 60-70% of available water can be depleted at maturity) when nearing maturity. This will minimize irrigation water supply needs, fuel and labor for the season and allow the off-season precipitation to recharge the soil profile.
Approximate water use or ET by crop to reach maturity is presented in Table 2. Details of how to calculate irrigation requirements using this table are provided in https://extension.umn.edu/irrigation/irrigation-management-strategies.
Table 3. Estimated normal water requirements for corn (95 RM) and soybeans between various growth stages and maturity in Minnesota.
| Growth stage | Water use (ET) to maturity
(inches) |
|---|
| Corn | |
| Blister (R2) | 7.0-7.5 |
| Milk (R3) | 4.8-5.3 |
| Dough (R4) | 3.2-3.6 |
| Beginning dent (R4.7) | 2.1-2.4 |
| Full dent (R5) | 1.6-1.8 |
| 1/2 Milk line (R5.5) | 0.9-1.2 |
| Soybean | |
| Full flowering (R2) | 6.8-7.6 |
| Full pod (R4) | 4.0-4.8 |
| Beginning seed (R5) | 2.7-3.3 |
| Full seed (R6) | 1.0-1.4 |
| Beginning maturity (R7) | 0.4-0.7 |
Source : umn.edu