Figure 1. Weather-related cause of crop loss in Pennsylvania (1989-2021)
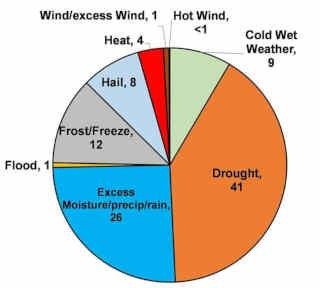
Percentage of total payments received during 1989-2021 for all weather-related causes of loss in Pennsylvania.
What crops have been affected the most?
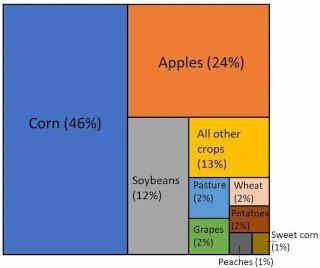
Pennsylvania farmers have received payments for more than 25 commodities in total. However, the top 10 crops make up for more than 98% of the payments received. These crops are shown in Fig. 2 using boxes relative to their proportion of total payments. Roughly half (46%) of the payments were received for loss of corn crop, followed by 24% for apples, and 12% for soybean. Specialty crops, such as grapes and peaches, also account for a small proportion.
Corn (74%) and soybean (14%) account for 88% of total payments received for drought. 80% of payments received for excess moisture/precip/rain have been for corn (42%), soybeans (21%), and apples (17%). Apples and grapes account for the most payments received for damage from freeze and frost. Apples also account for half the payments received for cold wet weather, followed by corn (19%) and soybeans (8%).
Figure 2. Top 10 commodities for which payments were received due to weather-related loss in Pennsylvania during 1989-2021.
Regional differences in weather-related crop loss
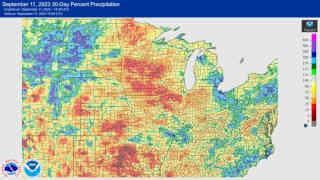
Regions within Pennsylvania have encountered variable causes of loss relative to others in individual years. This geographical distribution is likely a result of a combination of general weather characteristics as well as crop distribution patterns within the state. Figure 3 shows the percentage of payments received corresponding to each primary causes of loss for all counties in the state during 1989-2021. Counties with darker red color means greater percentage of payments were received in that county due to a certain cause of loss than the ones with lighter shade. Each cause of loss has a unique distribution within the state, which highlights the vulnerability of local agricultural enterprise to weather and climate-related crop loss. These maps can be relied on for assessing regional risk exposure to economic risk.
Figure 3. Maps showing spatial distribution for payments received for each cause of crop loss in Pennsylvania during 1989-2021. The quantity represented in each map is the percentage of total payments received for a given cause relative to all weather-related causes.
Insurance loss data for Pennsylvania and beyond are made available by USDA Climate Hubs.
Source : psu.edu