| Previous | Current | Change |
|---|
| USD Index | 107.92 | 106.65 | -1.27 |
| Crude Oil | 97.92 | 94.81 | -3.11 |
| DJIA | 31,257 | 31,818 | 561 |
Corn
Ethanol production for the week ending July 15 was 1.034 million barrels per day, up 29,000 from the previous week. Ethanol stocks were 23.553 million barrels, down 53,000 compared to last week. Corn net sales reported by exporters for July 8-14, 2022, were up compared to last week with net sales of 1.3 million bushels for the 2021/22 marketing year and net sales of 22.4 million bushels for the 2022/23 marketing year. Exports for the same period were up 21% from last week at 43.6 million bushels. Corn export sales and commitments were 97% of the USDA estimated total exports for the 2021/22 marketing year (September 1 to August 31) compared to the previous 5-year average of 102%. Across Tennessee, average corn basis (cash price-nearby futures price) strengthened or remained unchanged at Northwest, West-Central, North-Central, and Mississippi River elevators and barge points and weakened at West elevators and barge points. Overall, basis for the week ranged from 30 to 85 over, with an average of 58 over the September futures at elevators and barge points. September 2022 corn futures closed at $5.64, down 40 cents since last Friday. For the week, September 2022 corn futures traded between $5.61 and $6.23. Sep/Dec and Sep/Mar future spreads were 0 and 7 cents.
| Corn | Sep 22 | Change | Dec 22 | Change |
|---|
| Price | $5.64 | -$0.40 | $5.64 | -$0.39 |
| Support | $5.47 | -$0.40 | $5.44 | -$0.36 |
| Resistance | $6.01 | -$0.21 | $6.07 | -$0.11 |
| 20 Day MA | $6.17 | -$0.31 | $6.10 | -$0.29 |
| 50 Day MA | $6.86 | -$0.16 | $6.77 | -$0.13 |
| 100 Day MA | $6.98 | -$0.01 | $6.84 | -$0.01 |
| 4-Week High | $7.00 | -$0.54 | $6.92 | -$0.57 |
| 4-Week Low | $5.61 | -$0.21 | $5.61 | -$0.05 |
| Technical Trend | Down | = | Down | = |
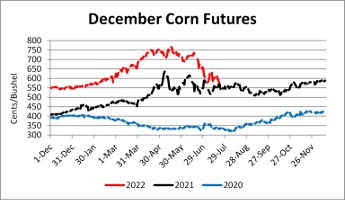
Nationally, the Crop Progress report estimated corn condition at 64% good-to-excellent and 11% poor-to-very-poor; corn silking at 37% compared to 15% last week, 52% last year, and a 5-year average of 48%; and corn dough at 6% compared to 2% last week, 7% last year, and a 5-year average of 7%. In Tennessee, corn condition was estimated at 40% good-to-excellent and 26% poor-to-very poor; corn silking at 82% compared to 67% last week, 78% last year, and a 5-year average of 84%; and corn dough at 31% compared to 11% last week, 31% last year, and a 5-year average of 36%. New crop cash prices at elevators and barge points ranged from $5.54 to $6.22. December 2022 corn futures closed at $5.64, down 39 cents since last Friday. Downside price protection could be obtained by purchasing a $5.70 December 2022 Put Option costing 44 cents establishing a $5.26 futures floor. March 2023 corn futures closed at $5.71, down 39 cents since last Friday.
Source : tennessee.edu