Here in Minnesota, there are a couple reasons why we do not have a tool like this right now. First, our biomass tends to be very low. If you get ~ 500 lb/ac of cereal rye biomass (pretty typical for MN cover crop research trials, see Figure 1 for visual) and that biomass is about 3.4% N, you only get 17 lbs of N total. Even if all that N was available at once, it’s a pretty moderate amount to credit. However, all of that N is not going to be available at once.
The other difficulty with estimating N release from cover crops is timing. Suppose you do have 17 lbs. of N in your aboveground biomass from cereal rye. Microbes will consume that N, use it to build their biomass, and release it when they die. As it is released, there’s potential for the released N to be used by the crop plant, another microbe, or lost to leaching. Marisol Berti’s work in North Dakota suggests that even when cover crops accumulate much more N than our cereal rye example, it doesn’t translate to increased corn yields or lower N needs. It may be that our cold temperatures slow the decomposition process such that the release of N from cover crops is not detectable over a single season.
Carbon to nitrogen ratios (C:N)
Cover crops can still have powerful effects on soil nitrogen. Some cover crops accrue more N than others (Berti’s talk on nitrogen cycling has several good examples of this). For microbes, the speed of decomposition and the fate of N partly depends on the C:N ratio. Microbes use C and N in the ratio of ~24:1. A higher C:N residue means microbes will scavenge extra N from your soil to build their bodies (“immobilized” N in organic forms), leaving cash crops empty handed. Lower C:N residue means that microbes will be less “stingy” with nitrogen once they decompose the cover crop, leaving some to be taken up by plants.
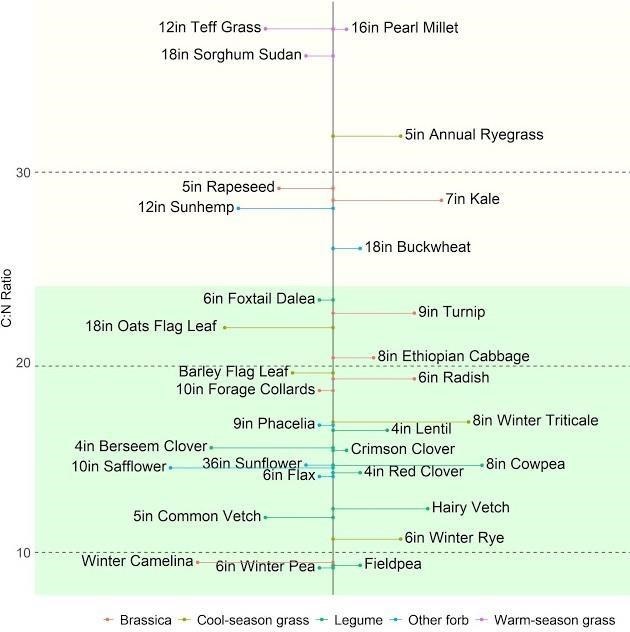
Figure 2 shows the C:N ratio of several common species of cover crops, as well as some more unusual options. Also listed is the height of the plant at the time of sampling (when available), as plant C:N ratios change as they go through different growth stages. Clearly, legumes tend to have low C:N ratios, as do many brassicas and some other broadleaf forbs. Grasses, especially warm-season grasses, tend to have higher C:N ratios.

Figure 2. C:N ratios of various cover crops from 2020 demonstration plots in East Ottertail County, MN, courtesy of the East Ottertail and Wadena Soil and Water Conservation Districts. The green zone includes plants measured with ratios likely to mineralize N (C:N <24:1), while the cream-colored zone include ratios likely to immobilize N in microbial bodies (C:N >24:1).
Other considerations
There are a lot of other considerations for planting cover crops, notably working around your cash crop operation. The Midwest Cover Crop Council Decision Tool can help you pick a cover crop that’s likely to emerge and establish during your window.
Cover crops can provide other important benefits like reducing erosion, building soil structure, and protecting water quality. But if your goal is to provide more plant-available N for your fields, considering the C:N ratio of your cover crop is also important.
Research is ongoing in the Upper Midwest on the interactions between cover crop growth and N supply, so at this point it is probably best not to plan on cover crop N credits for next year’s corn.
Source : umn.edu