Cotton strip assay is not a new technique for estimating soil microbial activities, but researchers mostly measured the loss in the cotton strip’s tensile strength which require an expensive and sophisticated instrument. We redesigned the protocol and excluded the tensile strength measuring, and instead, we calculated weight loss after recovery of the cotton strip from the ground, which is very similar to the popular ‘Soil Your Undies’ or ‘Whitey Tighties’ test. In addition, we took it a couple of steps further and formulated a new protocol to understand how different colors (microbial pigments), their sizes, patterns and abundances on the surface of the strip relate to microbial diversity and activity in the soil.
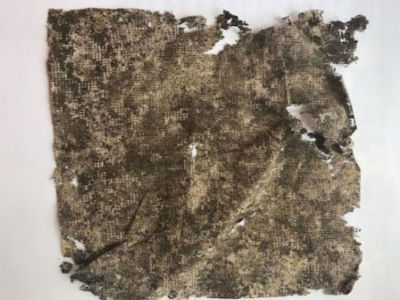
Figure 2. A recovered cotton strip from field that was studied for pigmentation and weight loss.
Under several ongoing research projects with South Dakota State University, we started researching how we can use ‘Cotton Strip Assay’ to compare different cover crop mixes to optimize microbial activity in the field and build up better soil health. The experiments were setup in Salem, SD, where we grew different cover crop mixes: i) grass (90% grass species, 10% broad leaf species), ii) BL (90% Broad leaf species, 10% grass species), iii) blend (50% grass and 50% broad leaf species) in a randomized replicated design in the fall of 2018. Corn was planted the next year and cotton strips were buried in the summer of 2019, between the corn rows, when corn plants were at the 4-6 leaf growth stage (Figure 1). The cotton strips were recovered 14, 21, and 28 days after burial (DAB) and secured for further analysis of pigmentation pattern and weight loss.
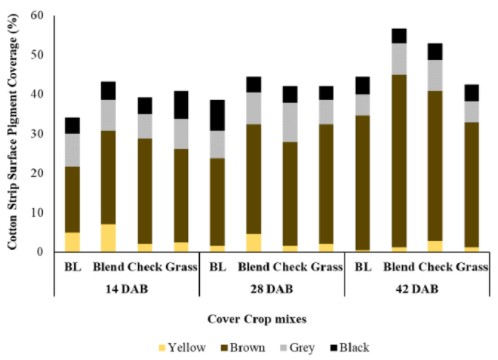
Figure 3. Pigmentation pattern in the cotton strips under different cover crop mixes. Colors indicate the color of the pigments.
The pigments were mostly of four different colors: yellow, brown, grey and black, which indicated the pigments produced by the active and dominant microbes in the soil. We studied patterns and abundance of pigments on the cotton strips (Figure 2). Our preliminary results indicated that the blended 50-50 mix of grass and broad leaf cover crop species influenced the highest levels of microbial activity and diversity as indicated by the highest recorded pigmented area on the cotton strips (Figure 3). We also found that the brown pigments produced by the microbes strongly correlate with the microbial activity as indicated by the loss of cotton strip weights (Figure 4). It is an ongoing research, and we are studying the pigmentation in further details. However, these results give us promise that this method can be performed rapidly and easily in farm fields and reading colors is simpler than any laboratory tests. We hope to come up with more standardized and calibrated criterias and more updated protocols inthe near future.
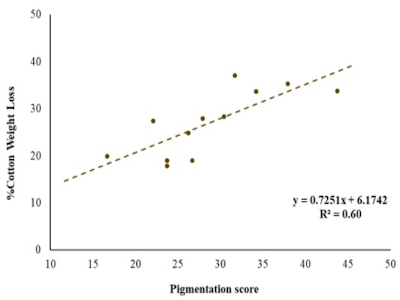
Figure 4. Correlation between brown pigmentation score and percent cotton weight loss.
Source : sdstate.edu