By Carl Zulauf
Department of Agricultural, Environmental and Development Economics
Ohio State University
BySanghyo Kim
Korea Rural Economic Institute
This article is a condensed version of a study published in the Journal of the American Society of Farm Managers and Rural Appraisers (J of ASFMRA) (Zulauf and Kim). It compares return and risk from storing corn vs. soybeans at the US market level. Motivations for the study are the increasing role of storage in marketing with the return of corn and soybean surpluses and the concern that storage is less profitable for soybeans than corn in the US. Concern particularly exists when storing beyond the South American soybean harvest (Frechette, for example). Return and risk to storing soybeans and corn are generally found to be similar. The few exceptions all favor soybeans, not corn.
Previous Studies
Five previous studies have examined returns to storing both corn and soybeans. Paul found average per bushel per year return to binspace of 1.6 cents for corn vs. -9.4 cents for soybeans. In contrast, Johnson found average per bushel net return of around 5 cents for corn but 60 cents for soybeans from storing at commercial facilities. Frechette also concludes (page 1117) “corn storage is much less well rewarded by the market” than soybean storage. Kastens and Dhuyvetter find the storage basis signal performs differently for corn and soybeans. For example, per bushel profit of unhedged storage increased 27 cents for soybeans but declined 17 cents for corn when decisions were based on deferred futures, a 3-year historical basis, and commercial storage rates. In the most recent study, Bektemirova (page 68) concludes “Results for soybean hedged and un-hedged storage strategies are dramatically different from corn results.” While each study finds returns to storing corn and soybeans differ, none test for statistical significance.
Procedures
Return and risk to storing corn and soybeans are examined for the two most common types of storage: cash storage and storage hedged with a short futures position that is offset when the stored crop is sold in the cash market. More dynamic storage strategies, such as rolling hedged storage to a more distant futures contract until a cash sale is made, are not examined.
The analysis begins with the 1974 market year and, thus, postdates the increase in price variability during the early 1970s (Kenyon, Jones, and McGuirk). The analysis ends with the 2017 market year. It was the last year with complete data at the time the analysis was conducted.
Cash price is the average monthly price paid to US farmers by first handlers as reported by USDA, NASS (US Department of Agriculture, National Agricultural Statistics Service). Storage starts in October, the month with the lowest average cash price. Corn price averaged $2.76 in both October and November. Soybean average price was $6.94 in October and $7.05 in November.
The Chicago July futures contract is used for the storage hedge. July is the latest, same-month futures contract traded for both corn and soybeans in their market year. Because pricing anomalies can arise during delivery month of a futures contract, June is the last storage month. Average settlement price of July futures is calculated for each month from October through June using prices from Barchart.com.
Per bushel gross return to cash storage is calculated monthly as average US cash price for the end-of-storage-period month (November through June) minus average cash price for October. Per bushel gross return for hedged storage is calculated as change in cash price plus change in futures price, or equivalently change in cash-futures basis, over the storage period. Net return to storage equals gross return minus interest opportunity cost of storing instead of selling at harvest and physical storage cost at commercial facilities to keep the crop in useable condition. Physical storage cost is usually considered to be more for commercial than on-farm storage. Hedge storage cost includes brokerage fee plus liquidity cost for the futures trade. Storage cost is discussed further in Data Note 2.
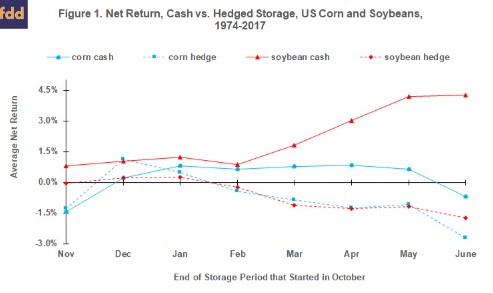
Findings: Average net return, expressed as a percent of the October cash price, is higher for cash storage of soybeans than corn at all 8 storage periods (see Figure 1). In contrast, average net return is often nearly identical for hedge storage. At the commonly-used 95% confidence level and using a paired t-test, average percent net return to storing corn and soybeans differ statistically for only 3 of the 16 storage combinations: October-November cash and hedge storage, and October-June cash storage. Net return is higher for soybeans in each of these 3 storage combinations.