Prevent plant is a provision of publically subsidized individual farm revenue and yield insurance. Specifically, if an insured cause of loss delays planting to or after a date set by USDA, RMA (US Department of Agriculture, Risk Management Agency), a farmer has the decision to plant a crop or not plant a crop and take a prevent plant payment. Prevent plant is, in effect, a conditional land set aside decision for a farmer triggered when an insured cause of loss delays planting until the RMA set date. Prevent plant was first offered in 1995, following a provision in the Federal Crop Insurance Reform and Department of Agriculture Reorganization Act of 1994 that RMA offer prevent plant as a basic part of crop insurance (USDA, Office of Inspector General). For additional discussion of prevent plant, see the farmdoc daily articles of May 3, 2022, May 4, 2022, and May 13, 2022.
Analysis
Figure 1 contains prevent plant’s first decision day for corn and soybeans for North Central US states. It is not clear the dates align with the way planting usually progresses in the US. A south-to-north progression toward a later prevent plant first decision day is not clearly evident. In contrast, a west-to-east progression toward a later prevent plant first decision day is clearly evident, especially for corn.
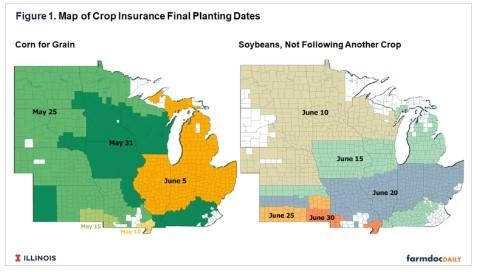
A state in Figure 1 is included in this study if all or a large majority of its counties have a single prevent plant first decision date. The states included in the corn analysis grouped by their first prevent plant decision day are: May 25 (Kansas, Nebraska, North Dakota, South Dakota); May 31 (Iowa, Kentucky, Minnesota, Wisconsin); and June 5 (Illinois, Indiana, Michigan, Ohio). A second criteria is added for soybeans: less than 5% of total soybean acres are double cropped (share is from USDA, NASS (National Agricultural Statistical Service), Quick Stats). Double cropped soybeans have a different first prevent plant decision date. The states included in the soybean analysis grouped by their first prevent plant decision day are: June 10 (Minnesota, Nebraska, North Dakota, South Dakota); June 15 (Iowa, Michigan); and June 20 (Indiana, Ohio).
Prevent plant and planted acres are available electronically from USDA, FSA (Farm Service Agency) starting with the 2007 crop year (see Data Note 1). Average planting progress is computed for a state as an Olympic average of planting progress as of the weekly report date closest to prevent plant’s first decision day. Also computed is an Olympic average of prevent plant’s share of planted plus prevent plant acres for 2007-2021. An Olympic average removes the lowest and highest values, which for these variables is likely due to extreme weather. An Olympic average is thus likely a more accurate measure of the underlying, normal rate of planting progress and prevent plant’s normal role in acreage.
Findings
North and South Dakota clearly differ from the other states in this analysis. As of prevent plant’s first decision day, planting progress is notably slower and share of acres in prevent plant is notably higher (see Figure 2 for corn and Figure 3 for soybeans).
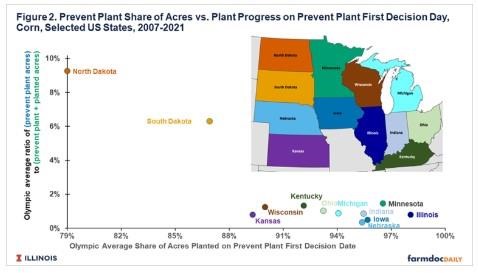
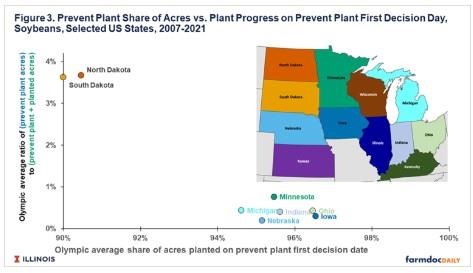
Planting progress is approximately equal to that of the average planting progress for other state-crop combinations in this analysis one week later for South Dakota corn and North and South Dakota soybeans, and two weeks later for North Dakota corn. Planting progress on June 1 for South Dakota corn was 95%, on June 7 for North Dakota corn was 96%, on June 17 for North Dakota soybeans was 98%, and on June 17 for South Dakota soybeans was 96%. Equivalent planting progress rates do not mean that the share of acres in prevent plant would be the same but Figures 2 and 3 do suggest fewer acres are likely to be in prevent plant in North and South Dakota if its planting progress was the same as that of other states on prevent plant’s first decision day.
The planting progress difference pre-dates crop insurance’s offering of prevent plant coverage in 1995. Using available data in Quick Stats, Olympic average planting progress on the first prevent plant date was 76% for South Dakota corn vs. 93% for the other corn states during 1979-1994 and 88% for South Dakota soybeans vs. 96% for the other soybean states during 1985-1994. North Dakota corn and soybean planting progress are not available until 1998.
Summary Observations
Since 2007, North and South Dakota have accounted for over a third of US corn and soybean prevent plant acres.
Average planting progress on the first date that corn and soybean prevent plant can be claimed is notably less for these two states than for the other North Central US states in this analysis.
This difference suggests that the current set of prevent plant first decision days provides differential opportunities across states to make the prevent plant decision.
The preceding point prompts an insurance policy question, “Should prevent plant first decision day be set so that on prevent plant first decision day the normal planting progress rate is the same for all areas?”, thus providing each area an equal opportunity to use prevent plant from the perspective of observed farmer planting progress behavior.
Equivalent normal planting progress rates for areas do not mean that their share of acres in prevent plant would be the same since other factors affect the prevent plant decision.
The evidence in this analysis does suggest prevent plant acres in North and South Dakota would likely be less if their prevent plant first decision day was later.
Moving prevent plant’s first decision date later raises a trade-off of increased indemnities for freeze and frost damage. To gain perspective on this trade-off, indemnities were calculated using RMA’s “Cause of Loss” data file for freeze and frost and for prevent planting for the 2007-2021 North Dakota and South Dakota corn and soybean crops. Indemnities totaled $4.5 billion for prevent plant and $91 million for freeze and frost.
Data Note
USDA, FSA prevent plant and planted acres are internally consistent. USDA, RMA also reports prevent plant acres and USDA, NASS also reports planted acres. Farms are told to report the same acres to insurance and FSA, but not all farms are in commodity programs or buy insurance. FSA and RMA classify prevent plant acres somewhat differently while FSA and NASS use slightly different definitions of planted acres.
Source : illinois.edu