Feeding cost of gain is sensitive to changes in feed conversions, corn prices, and alfalfa prices. Regression analysis was used to examine the relationship between feeding cost of gain, and feed conversion, corn prices, and alfalfa prices. Results are as follows: each 0.10 increase in feed conversion increases feeding cost of gain by $1.20 per cwt., each $0.10 per bushel increase in corn prices increases feeding cost of gain by $0.88 per cwt., and each $5 per ton increase in alfalfa prices increases feeding cost of gain by $0.45 per cwt.
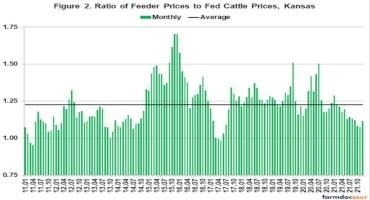
Feeder to Fed Cattle Price Ratio
The ratio of feeder to fed cattle prices since January 2011 is illustrated in Figure 2. Since January 2011, this ratio averaged 1.22. The feeder to fed price ratio was one standard deviation below (above) this average for 18 (19) months since January 2011. The average net return for the months in which the ratio was below one standard deviation of the average was $118 per head. In contrast, the average loss for the months in which the ratio was above one standard deviation was $265 per head. The average ratio for the 19 months with a feeder to fed price ratio that was above one standard deviation of the long-run average was 1.49. The feeder to fed cattle ratio averaged 1.24 and 1.17 in the first and second quarter of 2021, and 1.13 and 1.09 in the third and fourth quarters. Thus, the feeder to fed price ratio has been below the long-run average since the first quarter of 2021. This trend is expected to continue into the new year. The projected feeder to fed cattle price ratio for the first half of 2022 is expected to range from 1.15 to 1.20.
Net Return Prospects
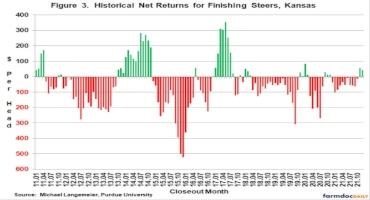
Monthly steer finishing net returns from January 2011 to December 2021 are presented in Figure 3. It is important to note that net returns were computed using closeout months rather than placement months, and that the estimates for November and December 2021 are projections. Net losses in the first quarter and second quarter of this year averaged $81 and $31, respectively. The loss in the second quarter was primarily due to relatively high feed costs because as noted above the feeder to fed cattle ratio was below the long-run average during this quarter. Losses in the third quarter averaged $56 per head. Average net returns are projected to be approximately $30 per head in the fourth quarter of 2021, ranging from a loss of $13 in October to a net return of $56 in November.
Historical and breakeven prices for the last ten years, as well as projected breakeven prices through the December of 2021, are illustrated in Figure 4. Breakeven prices for the first and second quarter of 2021 averaged approximately $119 and $122 per cwt. Average breakeven prices for the third quarter and fourth quarter were approximately $125 and $130, respectively. Due to relatively higher feeder prices, breakeven prices for the first and second quarters of 2022 are expected to range from $134 to $137. Combining these breakeven prices with Livestock Marketing Information Center (LMIC) fed cattle price projections results in expected losses in the first quarter and small positive net returns in the second quarter of 2022. Due to the amount uncertainty related to the current market environment, our typical caveats apply to these projections. Net return prospects could change rapidly.

Conclusions
This article discussed recent trends in feeding cost of gain, the feeder to fed price ratio, breakeven prices, and cattle finishing net returns. Average cattle finishing losses in 2021 were estimated to be approximately $35 per head. Current breakeven and fed cattle price projections suggest that net returns will be similar to those in 2021 in the first quarter of 2022, and closer to breakeven levels in the second quarter of 2022.
Source : illinois.edu