Average cash rents vary across Illinois, as illustrated in Figure 2, which shows average county cash rents released by NASS on August 28. The counties with the eight highest cash rents are all located in central Illinois: $294 per acre in Macon County, $292 in Sangamon, $287 in Logan, $284 in Moultrie, $281 in Piatt, $274 in Champaign, $272 in Christian, and $266 in De Witt. Higher cash rents also occur in northern Illinois (Carrol at $264 per acre, DeKalb at $262 per acre) and western Illinois (McDonough at $256 per acre).
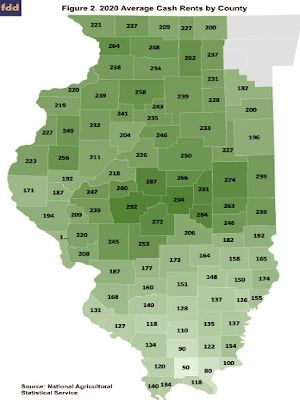
Southern Illinois has lower per acre cash rents. The counties with the five lowest cash rents are Johnson at $50 per acre, Pope at $80 per acre, Williamson at $90 per acre, Hardin at $100 per acre, and Franklin at $110 per acre.
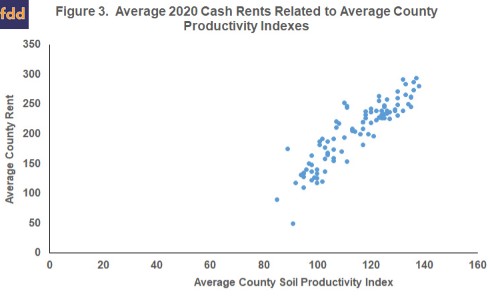
Differences in soil productivity explain a large part of the variations in cash rents. Figure 3 shows a scatter graph of average 2020 county cash rents related to the average county soil productivity index (SPI). The SPI is published for Illinois soils by the Department of Natural Resources and Environmental Science at the University of Illinois (click here for more information). Higher SPIs are correlated with higher yields. Figure 3 shows the average county SPI and average 2020 cash rents, with the two series having a strong, positive correlation coefficient of .90. Higher SPIs tend to be located in central and northern Illinois (see farmdoc daily, November 7, 2017 for a map).
Farms within a county can vary from average SPIs. Based on the above relationship, a particular farm’s “average” cash rent can be found with the following equation (see farmdoc daily, November 7, 2017 for a discussion:
“Average” cash rent = -157 + (2.89 x SPI) + CRD adjustment
where CRD is the crop reporting district. CRD adjustments are shown in Table 1.
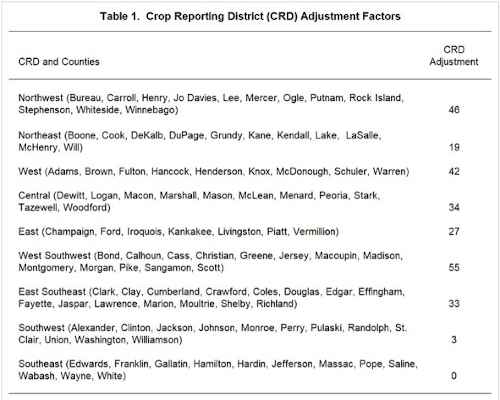
To illustrate, take a farm with a 134 SPI that is located in Champaign County. Champaign County is in the East CRD that has a CRD adjustment of $27 (see Table 1). Given this information, the average cash rent for this farm is $257 per acre (-157 + 2.89 x 134 PI + $27 CRD adjustment).
Variability in Cash Rents
Cash rents exhibit large variations from the above averages. For example, 60% of the rents on McLean County farms enrolled in Illinois Farm Business Farm Management (FBFM) in 2019 were within a range from $214 to $287 per acre. Note that the remaining 40% of the rents were outside that $73 per acre range. Rent variations often are due to the farm’s characteristics, including soil productivity, drainage, land access, land terrain, field size, and field obstructions. Desires of the landowner also play a large role in rent levels.
Professionally Managed Farmland
Annually, the Illinois Society of Professional Farm Managers and Rural Appraisers conducts a mid-year survey to ask its members about cash rent expectations in the upcoming year. This mid-year survey is part of the Society’s land value effort, which produces a land value booklet each year, giving farmland prices and rental information by regions of the state (click here for an archive of reports). Results for the 2020 mid-year survey were reported on a September 4th webinar. An archive of the webinar, along with the slides used during the webinar are available here.
The Illinois Society reports cash rents by four land classes: excellent, good, average, and fair. Land class divisions are made based on SPI ratings, with excellent farmland having SPIs ranging from 133 up to 147. SPI ranges for the remaining classes are shown in the first column of Table 2. Average corn yields vary by land class. For example, corn yield averaged 210 bushels per acre from 2015 to 2019 for counties that had average SPIs over 133 (see Table 2). The average corn yields were lower for other classes, 202 bushels per acre for the good land class, 178 for the average land class, and 151 for the fair land class.
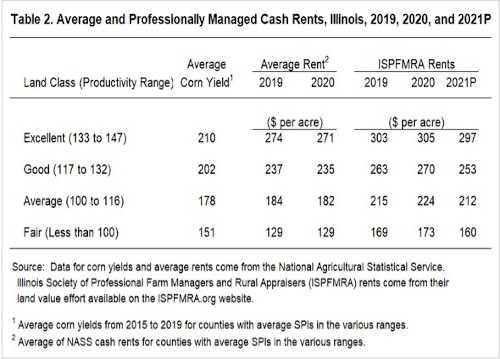
In 2020, the Illinois Society reported an average rent for excellent quality farmland that is professionally managed farmland of $305 per acre. As with all rents, there is a considerable range around the average. This $305 per acre average was $34 per acre higher than the $271 average reported for counties by NASS. Overall, professionally managed farmland has higher cash rents than NASS averages. A variety of reasons can be given for this difference, including the desires of farm owners who seek professional management for higher returns.
Illinois Society members are projecting lower rents in 2021. For excellent quality farmland, the 2021 cash rent is projected at $297 per acre, down $8 from the $305 average. Larger declines are projected for classes with lower productivity. Average cash rent for good land class farmland is projected at $253 per acre for 2021, down by $17 per acre from 2020 rents. The average cash rent for average land class is projected at $212 per acre, down by $12 from the 2020 average. Cash rent for fair quality farmland is projected at $160 per acre, down by $13 form the 2020 average.
Outlook for 2021 Cash Rents
COVID-19 control measures continue to darken agricultural outlook and will likely shadow the economy for the next several years, although the current outlook for Illinois farmers has recently brightened. Between August and September reports, USDA increased their projections for 2020 market year average (MYA) prices from $3.10 to $3.50 per bushel for corn and from $8.35 to $9.25 per bushel for soybeans. The Derecho storm impacts on Iowa, recent dry weather, and continued strong demand from China play a role in those price increases. Price increases, along with continuing prospects of Federal aid, likely diminish the chances of lowering cash rents for 2021 for parcels with cash rents at or below the current average levels.
We suggest calculating the average cash rent for a farm using the formula presented above based on SPI and location in the state to get a farm specific measure. More detail on this process is available in a farmdoc daily article published on November 7, 2017. While there may be reasons a cash rent rate is considerably above or below an average, rents that are considerably above average may need to be examined given the uncertainty in the agricultural economy.
Source : illinois.edu