By Bradley Zwilling
Illinois FBFM Association and Department of Agricultural and Consumer Economics
University of Illinois
There is a great deal of risk associated with production agriculture. Much of the management of the farm enterprise is oriented to mitigating or minimizing the various forms of risk present. Risk in production agriculture is associated with the uncertainty of the possible outcome of any decision made in the farm operation combined with things like commodity markets and weather which are out of the control of the farm operator. Today’s article looks to quantify risk numerically for farm revenue and expenses for a group of farms in the Illinois FBFM dataset. Once quantified, those metrics are evaluated and compared.
The data in this instance is a group of 1,369 participating Illinois FBFM farms. This group of farms are categorized as pure grain farms in that there is an absence of livestock enterprises on these farms. Those farm are then separated into four groups; 322 of them are located in northern Illinois, 310 of them are located in central Illinois and have lower productivity soils, 541 of the farm are located in central Illinois and have higher productivity soils and the final group are located in southern Illinois.
The three metrics considered are from the ‘per acre’ variables from the Illinois FBFM Economic Management Analysis report. This report has a focus on farm operator returns to management ability. Thus, an allowance for the unpaid operator labor and an allowance for an opportunity cost for operator capital are made.
In this work, we calculate the average, the standard deviation and the coefficient of variation for the various cost and returns shown in Table 1.
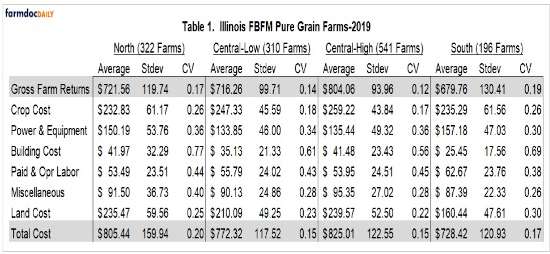
Averages in the data tell us much about this single years’ data. The standard deviations are also are very revealing. The coefficient of variation (CV) is calculated by dividing the standard deviation by the average. So, a CV measures the standard deviation (or variability) relative to the average. Lower CV’s typically tell of lesser amount of risk, variability and uncertainty. The data at hand show the CV’s of gross farm returns to be much the same across the four groups, and are highest for the southern Illinois farm and are lowest for the central Illinois higher soil productivity farms.
One might assume that CV’s would be higher for gross farm returns as they are subject to things beyond the control of the farm operator – weather (temperature, rain, etc.), and price. Expenses might be thought to be less variable as they seem to be generally similar from year to year with a general upward trend in most of the expenses incurred. This would tend to lead one to believe the CV’s of the expense measures would tell of lesser amount of variability or uncertainty. Table 1 tells that this in not the case for this group of 2019 grain farms in Illinois as the CV’s of gross farm returns are generally in the same range as the CV’s of total cost.
When looking at the individual components that make up total costs, building costs has the highest CV’s of each group. It has the lowest average cost, but the standard deviation is much closer to the average number, thus the larger CV’s. This is mainly due to the differences in IL farms when it comes to ownership and age of buildings. Buildings would include machine sheds, grain bins, barns, etc. The costs that are included would be repairs and economic depreciation.
Summary
While one might assume that gross farm returns would exhibit more signs of variability when compared to total expenses. This is not the case for this group of 2019 grain farms. Further work in this area could answer the question of does this variability change over time.