The same procedure used in the week 30 estimate is used here. The weekly crop conditions for week 34 are used to calculate an index and then the last 30 years of index values from week 34 are used in a regression model to estimate yields. Each state is estimated individually and then combined into a national estimate. Soybean acres are taken from the August crop production report.
Results
Figure 1 is a Likert graph of the soybean crop conditions for the last 20 years in the U.S. for the last 20 years. This national number is provided by the USDA in addition to the individual state numbers. The Likert graph has the percent of crop acres in the very poor and poor categories listed on the left-hand-side while the number of acres in the good and excellent categories is listed on the right-hand-side. The Likert graph is centered on the fair category which has the percentage listed in the center of the column.
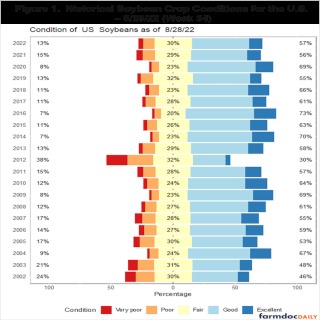
As Figure 1 illustrates, the national soybean crop conditions have remained steady for the last month. Currently, 13% of the soybeans are in the very poor and poor categories. At the end of July, there was 11% of the crop in these two categories. Nationally, the 2022 soybean condition looks almost identical to last year. In the last 20 years, 10 years have had the same or greater percentage of the crop in the bottom two categories compared to this year.
Table 1 shows the estimated yield per harvested acre prediction along with the confidence intervals for each state as of 8/28/22 (week 34.). This estimation is based on 30 years of observations from week #34. The R-square values have improved since the end of July but those are still lower than the corn prediction model. Soybeans are a more difficult crop to estimate for yields.
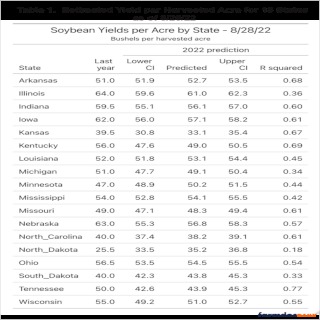
Table 2 shows the harvested acres from last year, the planted soybean acres this year, and the USDA August soybean estimate of acres. The USDA lowered estimated harvested acres slightly in two states from the June estimate. With this new estimate, soybean harvested acres are expected to increase 1.03% from last year.
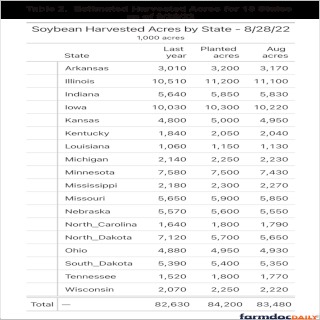
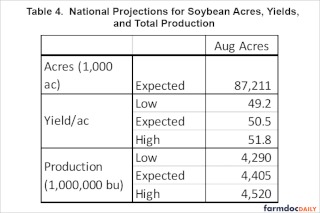
Table 3 shows the estimated soybean production by state and is the result of multiplying the August acre estimate by the expected yields. Because yields in some of the major soybean growing areas are estimated to be lower, total production is expected to be 0.68% lower even though acres are expected to be higher. Total production when scaled to a national level is expected to be 4.405 billion bushels with a range from 4.290 billion bushels to 4.52 billion bushels.
Table 4 lists these estimated national numbers. Table 4 also shows the calculated yield per acre. Last year, the national yield per acre was 51.4 bushels per acre. This year, the national yield per acre is expected to be nearly a full bushel lower at 50.5 bushels per acre with a range from 49.2 to 51.8 bushels per acre. The expected yield per acre has only changed by 0.1 bu/ac from the July estimate (50.4 bu/ac). The USDA August Crop Production Report is estimating a national yield of 51.9 which is at the top end of the confidence interval shown in this paper.
Source : illinois.edu