By Carl Zulauf
Department of Agricultural, Environmental and Development Economics
Ohio State University
Ben Brown
College of Agriculture, Food and Natural Resources
University of Missouri
Specialization is a defining attribute of US farming over the last 50 years. For example, share of farms that had beef cows, grew corn, grew wheat, sold hogs, and sold milk declined from 72%, 44%, 23%, 25%, and 20% to 36%, 15%, 5%, 3%, and 2%, respectively, between the 1964 and 2017 Censuses of Agriculture. Nevertheless, state shares of US farm, crop, and livestock cash receipts has changed little, implying a mostly stable geographical distribution of US farming by state. Individual livestock types have experienced more change, but even then no more than 20% of states had a share change that exceeded 1.5 percentage points over 50 years.
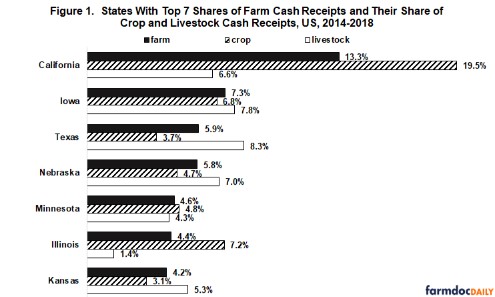
Procedures: The US Department of Agriculture, Economic Research Service’s farm income and wealth data set is the source for state cash receipts. Average state shares are computed for the 5 year periods of 1965-1969 and 2014-2018. A state’s share of farm, crop and livestock receipts represents that state’s share of cash receipts for the US. For example, during 2014-2018 California accounted for 13.3% of total US farm cash receipts (see Figure 1). Cash receipts for 2019 and 2020 are not used because of the potential for distortions from the COVID-19 pandemic and US tariff wars.
Top 7 Farm States, 2014-2018: To put the 50-year change of state’s share in perspective, Figure 1 contains the 2014-2018 share of US farm cash receipts for the top 7 states along with their share of US crop and livestock cash receipts. Kansas is the only state that is not a top 7 crop state. Illinois is the only state that is not a top 7 livestock state. Indiana replaces Kansas in the top 7 crop states. Wisconsin replaces Illinois in the top 7 livestock states. The top 7 farm, crop, and livestock states collectively account for 45%, 50%, and 44% of US farm, crop, and livestock cash receipts, respectively.
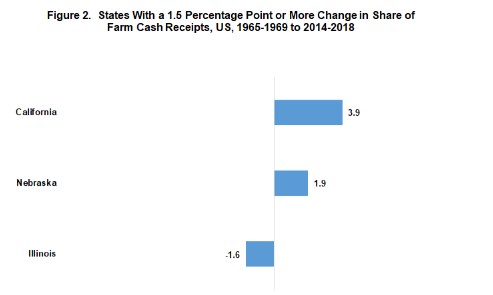
Farm Cash Receipts: Only 3 states experienced a change in their share of US farm cash receipts of 1.5 percentage point (pp) or more: California, +3.9 pp (9.4% to 13.3%); Nebraska, +1.9 pp (3.9% to 5.8%); and Illinois, -1.7 pp (6.1% to 4.4%) (see Figure 2). A gap exists to the next largest increase (+0.8 pp, Texas and Nebraska) and decline (-0.9 pp, New York). A change of 1.5 pp is used for Figure 2 because it is the 95% statistical confidence interval for change in farm cash receipts. A change of 1.5 pp or more thus has 95% statistical confidence that it is not due to random chance. The other measures examined in this paper have larger share changes and thus larger 95% statistical confidence intervals, but the 1.5 pp division point is used to maintain presentational consistency.
Crop Cash Receipts: Share of US crop cash receipts changed at least 1.5 pp for 7 states (see Figure 3). Their range was +6.0 pp (California) to -3.1 pp (Texas). California’s increase reflects growth in its production of high value horticultural and specialty crops, aided by its irrigation system and weather. Excluding California, states in Figure 3 with an increase in US crop share lie between the northern Mississippi River and Rocky Mountains. Both states with a decline are in the South.
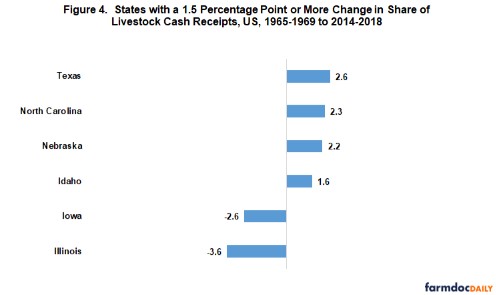
Livestock Cash Receipts: Share of US livestock cash receipts changed at least 1.5 pp for 6 states (see Figure 4). Their range was +2.6 pp (Texas) to -3.6 pp (Illinois). Both states whose share declined are in the Corn Belt. The 4 states whose share increased are scattered across the US.
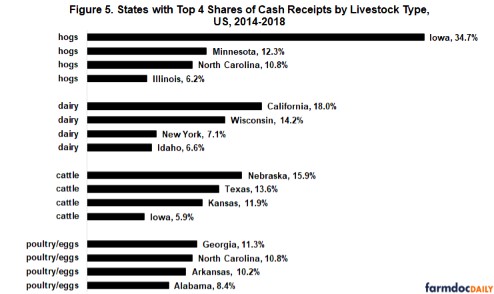
Top 4 States by Livestock Type, 2014-2018: The livestock sector is examined in more detail because of its transition to large scale confinement production, excluding cow-calf and stocker cattle production. To put the change in share by livestock type in perspective, Figure 5 contains the 2014-2018 share of US cash receipts for the top 4 states by livestock type. The shares in the top 4 states sum to 64%, 47%, 46%, and 41% for hogs, cattle, dairy, and poultry/eggs, respectively. By this measure, production of hogs is the most concentrated, largely due to Iowa’s 35% share, the single largest state-livestock share. The top 4 states for poultry/eggs are located in the South. For cattle they are located in the area between the Mississippi River and Rocky Mountains. Three of the four largest hog states are in the Corn Belt. The top 4 states for dairy are located in different regions. The discussion of change in state shares that follows is organized by the number of states with a change that is 1.5 pp or greater, starting with cattle which has the smallest number of such states.
Cattle Cash Receipts: Share of US cattle cash receipts changed by at least 1.5 pp for 6 states (see Figure 6). Largest increase was Nebraska (+8.0 pp). Largest decline was Iowa (-5.6 pp). Combined increase in the Plain States of Nebraska, Kansas, and Texas was +18.2 pp. Combined decline in Iowa and Illinois was -9.1 pp.
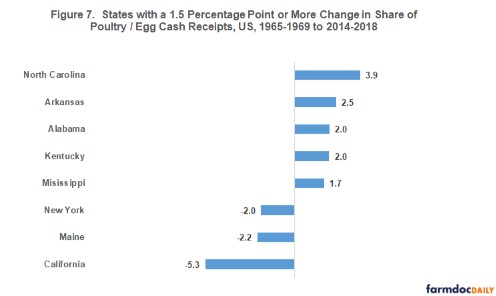
Poultry/Egg Cash Receipts. Share of US poultry/egg cash receipts, which includes broilers, changed by at least 1.5 pp for 8 states (see Figure 7). Largest increase was North Carolina (+3.9 pp). Largest decline was California (-5.3 pp). Combined increase in the Southern states of North Carolina, Arkansas, Alabama, Kentucky, and Mississippi was +12.1 pp.
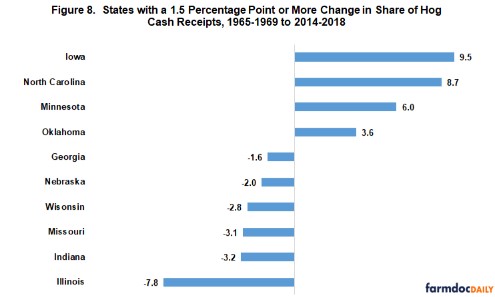
Hog Cash Receipts: Share of US hog cash receipts changed by at least 1.5 pp for 10 states (see Figure 8). Largest increase was Iowa (+9.5 pp), almost all of which has occurred since 2000. Largest decline was Illinois (-7.8 pp); however, since 2000 Illinois’s share of US hog cash receipts has declined by only 1.0 pp. Net change in the Corn Belt states of Iowa, Minnesota, Indiana, and Illinois, plus the neighboring states of Nebraska, Wisconsin, and Missouri was -3.4 pp., as the +15.5 pp increase in Iowa and Minnesota shares was more than offset by declines in the other states. Although North Carolina’s share of US hog cash receipts grew by +8.7 pp over the last 50 years, its share has declined since 2000 by -4.1 pp.
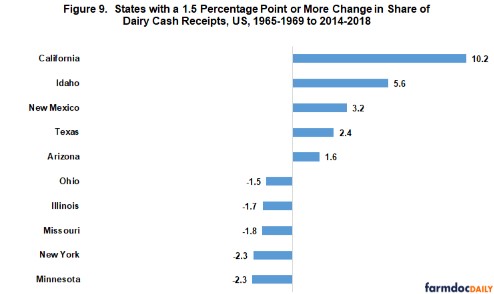
Dairy Cash Receipts: Like hogs, share of US dairy cash receipts changed by at least 1.5 pp for 10 states (see Figure 9). Largest increase was California (+10.2 pp), which is also the largest individual state-livestock increase. California’s share of US dairy cash receipts has, however, not changed since 2000. Largest decline was Minnesota and New York, both at -2.3 pp. The 5 states in Figure 9 whose share increased lie west of the 5 states whose share declined.
Concluding Observations
Despite all the changes in US agriculture since the late 1960s, geographical distribution of US farm cash receipts by state has changed little. Over this 50 year period, only 3 states have experienced a change of more than 1.5 pp in their share of US farm cash receipts.
The same conclusion holds for aggregate US crop and livestock cash receipts, although change in share is larger. Seven and six states, respectively, had a 1.5 pp or more change in their share.
For individual livestock, regional concentration has occurred, especially for hogs; but in general change in state share is muted and production remains dispersed across the US.
Specialization at the farm level, which clearly has occurred and is documented in the first paragraph of this article, does not necessarily translate into specialization for larger geographical areas, including states. Loss of production as farms become fewer can be offset by remaining farms producing more. Fewer, larger farms producing a given product is a dominant theme in the US.
A changing mix of products does not necessarily mean a change in more aggregate shares. Losses in one product can be offset by gains in another product. Large gains by California in dairy (see Figure 9) were mostly offset by losses in cattle and poultry/eggs (see Figures 6 and 7). Broilers’ share of US livestock cash receipts grew from 5% in 1965-1969 to 16% in 2014-2018. However, livestock’s share of total farm cash receipts increased (decreased) by 1.5 pp or more for only 4 (2) states.
The generally stable distribution of aggregate farm, crop, and livestock cash receipts by state over the past 50 years implies it has been difficult to create geographically specific advantages in US farm production. In particular, changes in production technology were largely transferable across the US.
Source : illinois.edu