By Gary Schnitkey and Bruce Sherrick
Department of Agricultural and Consumer Economics
University of Illinois
The Illinois Society of Professional Farm Managers and Rural Appraisers recently released their estimates of 2018 cash rents as well as their expectations for 2019 cash rents. Cash rent levels on professionally managed farmland were roughly the same in 2018 as in 2017. Given corn prices continuing in the mid-$3.00 range, 2019 cash rents would be expected to be the same or have slight declines from 2019 levels.
Background on Illinois Society of Professional Farm Managers and Rural Appraisers
The Illinois Society of Professional Farm Managers and Rural Appraisers (ISPFMRA) is an association of farm managers and rural appraisers. Farm managers care for the farmland of absentee landowners, offering services that include selecting farmer tenants, negotiating rental arrangements with farmer tenants, inspecting farmland, and providing reports to landowners. Rural appraisers provide valuations of farm properties, mostly for legal purposes such as providing documentation for loans and providing prices used for settling estates. More information on the ISPFMRA, including a directory of members, is available on the ISPFMRA website (www.ispfmra.org).
The ISPFMRA conducts an annual effort to collect data on farmland values and lease trends for nine regions of Illinois, resulting in a yearly "Illinois Farmland Values and Lease Trend" booklet. Booklets for previous years are available on the ISPFMRA website. The 2018 Booklet can be purchased on the ISPFMRA website.
2018 Cash Rents
Figure 1 presents summary information on average cash rents on Illinois farmland. More detailed information for the nine regions is available in the 2018 Booklet. Figure 1 shows average cash rents on professionally managed farmland for the years from 2007 through 2018 for four land classes:
- Excellent farmland has productivity indexes (PIs) that are over 133. These PIs are based on ratings contained in Bulletin 811, Optimum Crop Productivity Ratings for Illinois Soils. These soils have high yielding capabilities and are typically located in the northern and central part of the state. A map of PIs for Illinois is available here.
- Good farmland has PIs between 117 and 132. Fair farmland is located throughout Illinois, with larger pocket sin western Illinois and eastern Illinois.
- Average farmland has PIs between 100 and 116. Fair farmland is located throughout Illinois, with larger pocket sin western Illinois and eastern Illinois.
- Fair farmland has PIs less than 100. Fair farmland typically is located in southern Illinois
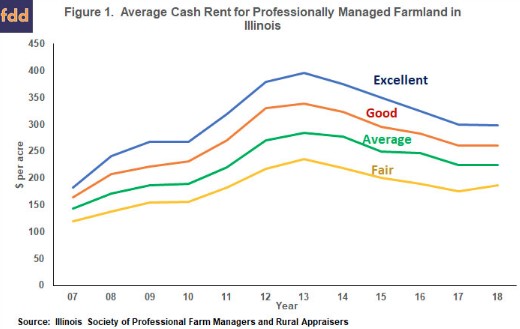
Overall, crop yields will be the highest for excellent quality farmland and decrease for good, average, and fair classes. As a result, cash rents averaged highest for excellent class farmland and the lowest for fair class farmland (see Figure 1). Figure 1 presents average cash rents over time. There are considerable ranges around these averages. On professionally managed farmland, for example, some excellent class farmland had rents considerable higher and lower than the averages. More detail is provided in the 2018 Booklet.
The four classes of farmland had the same trends. Average cash rents for all land classes increased from 2007 and reached highs in 2013. Cash rents then declined from 2013 to 2017. For example, excellent farmland had rents that increased from $183 per acre in 2007 to $396 per acre in 2013. From the 2013 high, cash rents decreased to $300 per acre in 2017. These rents follow with lags income levels on farms (see farmdoc daily, March 13, 2018, for a chart of incomes).
Cash rents in 2018 are roughly as in 2017. For example, excellent class farmland had a $300 cash rent in 2017 and $298 per acre in 2018. Good and average classes had the same rent in 2017 as in 2018: $260 per acre for good farmland and $225 per acre for average farmland. Fair productivity farmland has a slight increase: $175 per acre in 2017 to $186 in 2018.
ISPFMRA and Average Cash Rents
The ISPFMRA cash rents are some of the first published cash rents for 2018. Over time, ISPMFRA cash rents on professionally managed farmland follow closely rents based on rents that include more than just professionally managed farmland. To illustrate, Figure 2 shows cash rents for excellent farmland from ISPFMRA, the same series that is shown in Figure 1. Also shown are average cash rents for central Illinois farms having high-productivity farmland that are enrolled in Illinois Farm Business Farm Management (FBFM). FBFM cash rents are available in a Revenues and Costs publication available on farmdoc.
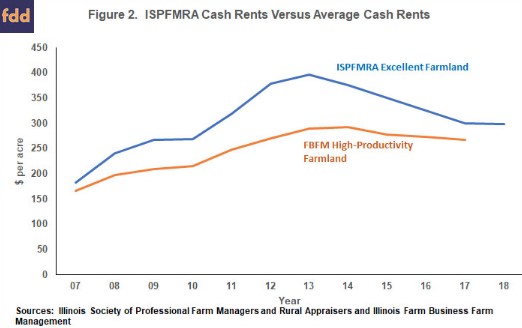
Overall, FBFM farms had lower cash rents than ISPFMRA, in large part because the FBFM high-productivity series contains all cash rents and not only those on professionally managed farmland. Over time, professionally managed farmland tend to have higher cash rents than farmland that is not professionally managed. While the ISPFMRA rents are higher, ISPFMRA and FBFM cash rents track each other, having a correlation coefficient of .95 over the years from 2007 to 2017. While highly correlated, ISPFMRA professional managed farmland has larger changes than the FBFM averages. For example, ISPFMRA average went up more than FBFM average during the 2010 to 2013 period when returns to farmland were high. ISPFMRA average rents have come down more since 2013 than have FBFM averages.
The small declines in ISPFMRA cash rents suggest that average cash rents had small changes between 2017 and 2018.
Expectations for 2019
ISPFMRA members were asked their expectations for 2019 cash rents. Obviously, economic conditions will impact 2019 cash rents. When asking cash rent expectations, we first indicated that the 2019 expected corn price was near $3.50 per bushel. In this case, 58% of the members responding to the survey indicated that farmland prices would stay the same while 36% indicated that cash rents would decline between $5 and $25 per acre (see Figure 3). Six percent of respondents indicated that cash rents would increase. A $3.50 price is roughly the same as prices have been s in 2016 and 2017. These expectations suggest continuing, modest declines in 2019 cash rents if prices remain roughly at their current levels.
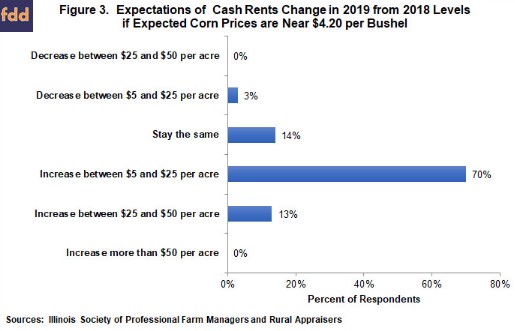
ISPFMRA members also were asked what would happen if the expected 2019 corn price was near $4.20 per bushel. In this case, 83% of respondents indicated that cash rents would increase. A $4.20 per bushel corn price is considerably higher than current expectations. However, the price is not outside the realm of possible 2018 rents.
We are still always away from setting 2019 cash rents. Survey responses indicated that corn prices continuing at current levels would result in modest declines in average cash rent levels on professionally managed farmland. Higher prices would result in increases in cash rents. Lower prices likely would result in lower cash rents.
Summary and Concluding Comments
Results suggest roughly stable cash rents on professionally managed farmland between 2017 and 2018. Given high correlations between ISFPRMA and other cash rent series, one should expect modest changes in average levels on other cash rent series. Given mid-$3.00 corn prices, farm managers indicated that cash rents would remain stable to decline slightly. Continuing these levels of cash rents may place some farms in the position of facing low incomes and deterioration of financial positions (see farmdoc daily, March 13, 2018). We are still several months away from setting cash rents. As always, much will depend on the 2018 growing season. Moreover, commodity demand conditions also will play a role in economic outcomes.