By Gary Schnitkey
Department of Agricultural and Consumer Economics
University of Illinois
Trends in the financial position of Illinois farms are presented in this article. Overall, farms gained financial strength from 2006 to 2012. Since 2012, working capital has declined. The net worth and debt-to-asset position of most farms remain strong, but per acre net worth has decreased and the debt-to-asset ratios have increased in recent years. Those are worrisome trends. Future financial performance depends on returns. Likely financial performance given differing commodity prices are presented at the end of this article.
The 2016 Balance Sheet
Table 1 shows a balance sheet averaged over farms enrolled in Illinois Farm Business Farm Management (FBFM). Farms included in this summary are sole proprietorships and have balance sheet information that is certified as being complete by FBFM field staff. The balance sheet information is as of the end of 2016. Information for 2017 has not been summarized and made available to the public at this point in time. Asset values in Table 1 are valued at their market values and are stated on a per acre basis. Percentages also are given which state that category's value as a percentage of total assets or, equivalently, as a percent of total liabilities plus net worth. Long-term assets, for example, are 55% of total assets, indicating that a high proportion of a farm's assets are long-term. Furthermore, total liabilities are 21% of total assets (see Table 1), indicating that the average debt-to-asset ratio is .21.
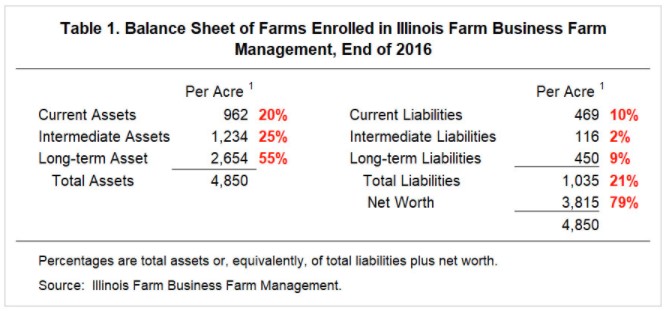
At the end of 2016, there was $4,850 per acre in total assets. Liabilities totaled $1,035 per acre. The debt-to-asset ratio for these Illinois farms is .21, which compares to a .13 debt-to-asset value for the entire U.S. agricultural sector as reported by the Economic Research Service (ERS), an agency of the U.S. Department of Agriculture (ERS, Assets, Debt, and Wealth). Both the FBFM and ERS debt-to-asset ratios are low relative to historical levels.
The remainder of this article provides trends from 19966 through 2016 on each components of Table 1's balance sheet. When examining trends, three periods are apparent:
- The 1996-2006 period consists of commodity prices that are relatively low compared to today's prices. During the period, market year average (MYA) prices reported by National Agricultural Statistical Service (NASS) averaged $2.23 per bushel for corn and $5.73 per bushel for soybeans.
- The 2007-2012 period is associated with increasing and high commodity prices. MYA prices averaged $5.02 per bushel for corn, more than double the $2.23 average from 1996-2006. Soybeans prices averaged $11.31, close to double the $5.73 average price from 1996-2006. Because of higher prices, net incomes on farms tended to be high relative to the 1996-2006 and 2013-2016 periods.
- The 2013-2016 period is associated with lower prices and lower incomes. Between 2013 and 2016, the MYA price for corn averaged $3.86, over $1.00 per bushel lower than the 2007-2012 average of $5.02. The 2013-2016 soybean average price is $10.41, $.90 lower than the 2007-2012 average from $10.41 per bushel
In general, balance sheet items strengthened throughout the 2007-2012 period relative to the relative stable 1996-2006 period. The 2013-2016 period is associated with stability in some balance sheet categories and deterioration in others.
Current Assets and Current Liabilities
Levels of current assets and current liabilities over time are shown in Figure 1. Current assets per acre were relatively stable from 1996 through 2006. During the 2007-2017 period of higher commodity prices, current assets on grain farms increased from $518 per acre in 2006 to $1,120 per acre in 2012. Major items in current assets include grain inventories, cash in checking and saving accounts, and prepaid expenses. During the period between 2007-2012 period, all their current items increased, but rising grain inventories accounted for the majority of rising current asset values. Within FBFM, grain inventories are valued at market prices at the end of the year. During 2006 through 2012, market prices were high and generally increasing, leading to high grain inventory valuations.
During the 2013-2016 period, current assets declined from the $1,064 per acre in 2012 to $952 per acre in 2015. Current assets were $962 per acre in 2016, about the same as in 2015.
Lower commodity prices and lower incomes contributed to the decline in current assets.
Current liabilities have been steadily increasing throughout the entire 1996 through 2016 period shown in Figure 1. In 1996, current liabilities averaged $222 per acre. By 2016, current labilities averaged $468 per acre.
The difference between current assets and current liabilities represents working capital. Working capital provides a reserve of "liquid" assets that can be used to counter adverse events. A measure of working capital is the current ratio, which equals current assets divided by current liabilities.
During the 1996-2006 period, the current ratio averaged 1.64 (see Figure 2). The current ratio then increased through much of the 2007-2012 period, reaching a high of 3.07 in 2012. During this period, most farmers increased the working capital position of their operations. During the 2013-2016 period, the current ratio has declined. The current ratio equaled 2.07 in 2015 and 2.10 in 2016 (see Figure 2). The current ratio did not decline in 2016 because incomes were high enough so that working capital reserves were not used to meet cash flows (see farmdoc daily, November 21, 2017 for more discussion).
Intermediate Assets and Intermediate Liabilities
On Illinois grain farms, much of the value in intermediate assets is associated with farm machinery. On FBFM balance sheets, farm machinery is valued at a market prices. During the 1996-2006 period, intermediate asset values increased in most years, likely reflecting the continued increases in machinery prices. Intermediate values were $527 per acre in 1996 and reached $621 per acre in 2006.
Intermediate asset values increased in each year during the 2007-2012 period, reaching $1,093 per acre in 2012. During the period, farmers used disposable cash to purchase machinery, leading to higher machinery values.
Intermediate machinery leveled off and declined slightly during the 2013-2016 period. Intermediate values were $1,231 per acre in 2013, $1,265 in 2014, $1,244 in 2015, and $1,234 in 2016. This leveling off occurred because most farmers decreased of capital purchases during the 2013-2016 period as compared to the 2007-2012 period.
Over the entire 1996-2016 period, intermediate liabilities averaged $98 per acre, but do show an increasing trend. Intermediate liabilities increased on an average yearly basis of $2 per acre. In 2016, intermediate liabilities averaged $116 per acre.
Long-term Assets and Long-term Liabilities
On Illinois grain farms, much of the value in long-term assets is associated with farmland. However, Illinois farmers tend to own a relatively small percentage of their land base. Of the farms described in this article, percent of acres owned is about 25% of farmed acres. Hence, the per acre values in Figure 4 have about .25 owned acres of farmland in its value.
When valuing farmland, Illinois FBFM uses a conservative approach. Farmland is valued at about three-quarters of market value. As a result, long-term assets - and total assets as well - will be conservatively valued.
As can be seen in Figure 4, long-term assets have increased throughout much of the 1996-2006 and 2007-2012 periods, matching the general trend of farmland price increases during these two periods (see farmdoc daily, August 9, 2016 for farmland price discussion). Long-term asset value increases were most pronounced during the 2007-2012 period when values increased from $1,310 per acre in 2007 to $2,427 per acre in 2012. The 2007-2012 period of higher commodity prices were associated with large increases in farmland prices.
Long-term asset values have flattened during the 2013-2016 period. Long-term asset values were $2,576 per acre in 2013, $2,676 in 2014, $2,671 in 2015, and $2,654 in 2016. Farmland prices have been stable to declining during the 2013-2016 period, providing a powerful impetus for long-term asset values to remain stable to decline slightly.
Long-term liabilities have slowly increased over the entire 1996-2016 period (see Figure 4). Long-term assets were $188 per acre in 1996 and increased to $450 per acre in 2016. Over the entire period, long-term liabilities increased an average $13 per acre in each year.
Total Assets, Total Liabilities, and Net Worth
Because intermediate and long-term assets account for the majority of total assets, trends in total assets roughly follow the same trends as intermediate and long-term assets (see Figure 5). Total assets increased slightly over the 1996-2006 period from $1,794 per acre in 1996 to $2,218 in 2006. Because of high incomes, machinery and other asset purchases, machinery price increases, and land value increases, total assets on farms increased from $2,660 per acre in 2007 to $4,642 per acre in 2012. The 2013-2016 period saw stabilizing asset values and then slight declines: Total assets were $4,872 per acre in 2013 and $4,988 per acre in 2014. Then, total assets declined to $4, 868 per acre in 2015 and $4,850 per acre in 2016.
During the entire time period, total liabilities have been increasing (see Figure 5). Total liabilities increased from $484 per acre in 1996 to $1,035 per acre in 2016.
Total assets minus total liabilities equal net worth. During the 1996-2006 period, net worth increased in seven out of ten years (see Table 6). Net worth began at $1,310 per acre in 1996 and increased to $1,730 per acre in 2006. The 2007-2012 period saw increases in net worth, reaching $3,748 per acre in 2012. Net worth continued to grow early in the 2013-2016 period but has been declining in recent years. Net worth was $3,979 per acre in 2014, $3,839 in 2015, and $3,815 in 2016.
After declining for many years, the debt-to-asset ratio has begun to increase. During the 1996-2006 period, the debt-to-asset ratio was relatively stable at .27. The debt-to-asset ratio then decrease during the 2007-2012 period to .19 in 2012. Since 2012, the debt-to-asset ratio has increased and was slightly above .21 at the end of 2016.
Summary, Caveats, and Moving Forward
Overall, farm balance sheets remain strong but there are some worrisome trends. In recent years, working capital has been declining and prospects are that economic conditions will not be conducive to building working capital in 2018. A poor year characterized by trend yields, mid-$3.00 corn prices, and mid-$9.00 soybean prices would be associated with large declines in working capital (see farmdoc daily, January 30, 2018).
The net worth and debt-to-asset position remains strong but are not improving. Net worth per acre has been declining slightly in recent years and debt-to-asset ratios have edged up. There is still are financial reserves suggesting that many farms could withstand several adverse years.
The above analysis includes data through 2016. While 2017 data has not been released yet, one can make reasonable projections. Net farm incomes in 2017 were projected to be below 2016 levels (see farmdoc daily, November 21, 2017). Those lower net incomes likely lead to continued deteriorations in working capital on most farms. Net worth likely will show small declines and average debt-to-asset ratios likely will increase. Overall, farms likely still are in a strong position at the end of 2017, but some financial deterioration has continued to occur.
The above analysis is based on averages. There will be farms that face much greater difficulties than those described by these averages. Farms that have a higher proportion of their farms cash rented will face worse situation than depicted above. The 21% of the acre that is owned for the "average" farm provides a great deal of financial stability that does not exist for those the rent more than 90% of their farming operations. Moreover, younger operators likely face more adversity as they have not built up a base of owned land or other financial reserves.
The question then is what the financial position will look like in the future. Much will depend on prices and yields. Below is a characterization of results in the future given that yields are near trend levels. Prices given below represent market year average (MYA) prices:
- Corn prices above $4 per bushel and soybean prices above $10 per bushel will result in improving working capital and overall financial strengthening on most farms.
- Corn prices in the high $3 per bushel range and soybeans in the mid to high $9 range will result in stable to decreasing working capital and roughly stable financial position on most farms.
- Corn prices in the low $3 per bushel range and soybeans in the low $9 per bushel range will result in rapid declines in working capital and declining financial strength of farms.
- Corn prices below $3 per bushel and soybean prices below $9 per bushel will result in the elimination of working capital reserves and rapid declines in financial strength. Depending on the number of years of this price scenario, many loan defaults and restructuring would be required.
Obviously, yields come into play in determining returns and financial performance. For example, above average yields would counter some or all the impacts of lower prices, as has happened in recent years (see farmdoc daily, November 21, 2017). At this point in time, the dire situation of below $3 corn prices and below $9 soybean prices appears improbable, but this is agriculture and adverse events have happened in the past. Alternatively, there are scenarios where higher prices can occur resulting in increases in financial strength. Given current expectations, a most likely scenario is continuing tight cash flows, declines in working capital, and increases in debt-to-asset ratio. Time will tell.
Acknowledgements
The author would like to acknowledge that data used in this study comes from the local Farm Business Farm Management (FBFM) Associations across the State of Illinois. Without their cooperation, information as comprehensive and accurate as this would not be available for educational purposes. FBFM, which consists of 5,600 plus farmers and 62 professional field staff, is a not-for-profit organization available to all farm operators in Illinois. FBFM field staff provide on-farm counsel with computerized recordkeeping, farm financial management, business entity planning and income tax management. For more information, please contact the State FBFM Office located at the University of Illinois Department of Agricultural and Consumer Economics at 217-333-5511 or visit the FBFM website at www.fbfm.org.