By Jonathan Coppess, Gary Schnitkey, Nick Paulson, Carl Zulauf
Background
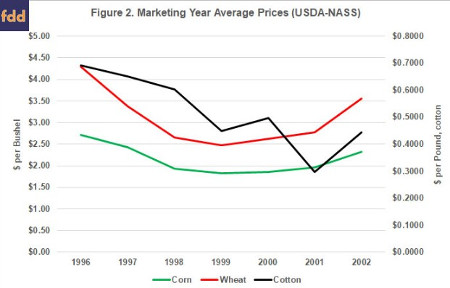
In 1996, Congress upended more than 60 years of farm policy (Coppess 2018). The Federal Agricultural Improvement and Reform Act of 1996 decoupled farm payments from production and prices; replacing target prices with annual contract payments. A subsequent decline in crop prices from the fallout of the Asian financial crisis resulted in additional payments approved by Congress on an ad hoc basis and known as Market Loss Assistance Payments. Figure 1 uses data provided by the Commodity Credit Corporation (CCC) to illustrate total payments by crop year under the Production Flexibility Contracts (PFC) from the 1996 Farm Bill and for the additional Marketing Loss Assistance (MLA) payments in subsequent ad hoc legislation (USDA-FSA, CCC Budget Essentials). Figure 2 illustrates the marketing year average (MYA) prices for corn, cotton and wheat during these years.
Return of Fixed Price Policy in the 2002 Farm Bill
In 2001, the House and Senate Ag Committees were able to secure additional baseline funding through the budget process and the 2002 Farm Bill was written to spend the estimated additional $73.5 billion; most of the funding went to commodities and specifically to a re-created fixed price policy in the form of target prices in the Counter-cyclical Payments (CCP) program. These payments were in addition to direct payments made every year, a continuation of the PFC concept from the 1996 Farm Bill, as well as in addition to any marketing assistance loan benefits or Loan Deficiency Payments (LDP).
The 1996 Farm Bill had also decoupled payments from production decisions using contract acres for each crop and allowing the farmer to plant any commodity on the acres without impacting payments. Renamed base acres in 2002, this reform has continued in each subsequent reauthorization of farm policy since 1996. Direct payments were designed as a fixed payment rate on program yields and paid on 85% of the base acres for the crop. For the CCP, Congress fixed statutory target prices but payments were triggered using the MYA as compared to an effective target price that subtracted out the direct payment rate. For example, corn base received direct payments at $0.28 per bushel and had a target price of $2.60 per bushel for an effective target price of $2.32 per bushel.
The 2014 farm bill renamed target prices, reference prices. It also eliminated the direct payment program. Thus, under the 2014 farm bill, no adjustments were made to the reference prices. The reference price and effective reference price were the same.
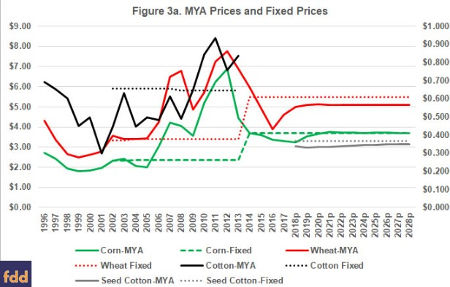
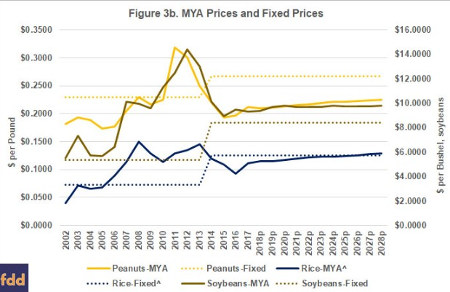
Figures 3a and 3b compare MYA prices with the statutory fixed prices (effective target prices 2002-2014; reference prices 2014-2028p). Notably, cotton's fixed price was eliminated by the 2014 Farm Bill and reinstated for the 2018 crop year by the Bipartisan Budget Act of 2018. Projected prices are from the Congressional Budget Office's April 2018 Baseline (CBO, April 2018). The 2002 Farm Bill also brought soybeans and peanuts into the CCP program, allowing farmers to add base acres and providing them with fixed prices as well. Figure 3b compares prices for soybeans, peanuts and rice; note that rice has been converted to dollars per pound from the dollars per hundredweight.
Measuring Fixed Price Policy: Comparison with MYA Prices
From Figures 3a and 3b it is apparent that the prices fixed in statute by Congress are not the same relative to marketing year average prices. Because the commodities use different measures of production (bushels, pounds and hundredweight), however, it is difficult to compare them. What follows in this discussion are multiple methods for comparing the prices as fixed by Congress in the farm bill.
Figure 4 provides the first comparison among the crops. The lines in Figure 4 represent the effective fixed price (target or reference) in the statute divided by the MYA for the crop each year. The years above 100% are years in which the fixed price is higher than the MYA and thus a payment should have been triggered by the program Similarly, the higher the percentage in the year the larger the expected payment for the crop. For example, in 2004, the effective reference price for cotton was $0.6573 per pound and the MYA was $0.447 per pound meaning that the effective target price that year was 147% of the MYA and thus would have triggered large CCP payments. Also, in 2015 the peanut fixed price (reference price) was $0.2675 per pound and the MYA was $0.193 per pound meaning that the reference price was 139% of the MYA and expected to trigger large payments under PLC.
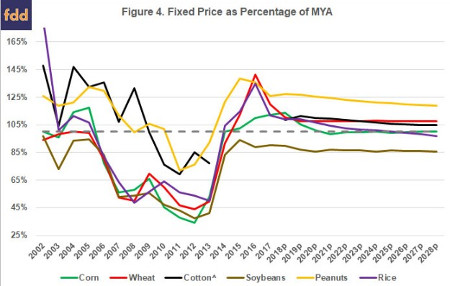
From Figure 4, it appears that cotton and peanuts received the most favorable target prices in the 2002 Farm Bill and that peanuts received the most favorable reference price in the 2014 Farm Bill. Note that for cotton, the projected years after 2018 are for seed cotton as added by the Bipartisan Budget Act of 2018 (farmdoc daily, February 14, 2018). Using this method of comparison, continuation of current reference prices would continue to benefit those owning peanut base more than farmers owning base of the other covered commodities. On average for the projected years of the CBO April 2018 Baseline, peanuts reference price is 123% of the forecast MYA prices in the 2018 to 2028 crop years. Seed cotton and wheat follow with a reference price that averages 108% of the forecast MYA prices, while rice averages 103% and corn 101%. Only the reference price for soybeans remains below the forecast MYA prices, averaging 87%.
Table 1 compares the effective target prices and the 2014 reference prices with the average MYA prices for the 5 and 10 year intervals prior to the bill's passage in Congress. This comparison looks to the fixed price level selected by Congress with the known crop prices leading up to that farm bill.
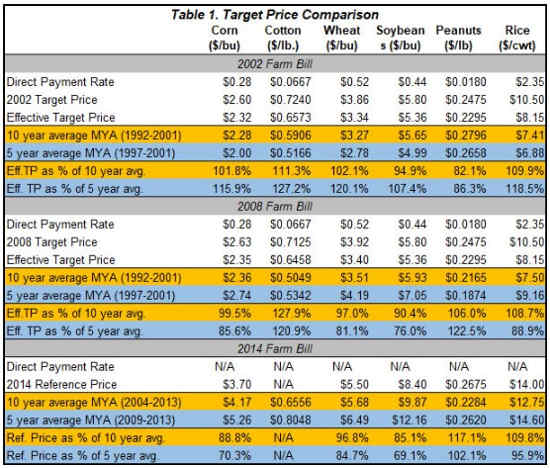
Based on this method of comparison, cotton's 2002 target price was the most favorable among the commodities in the program and continued to have the most favorable target price in the 2008 Farm Bill. Figure 5 reinforces this conclusion; based on actual expenditures by the Commodity Credit Corporation (CCC) during the crop years of the 2002 Farm Bill, cotton received far more under the target prices and, along with peanuts, triggered payments each crop year.

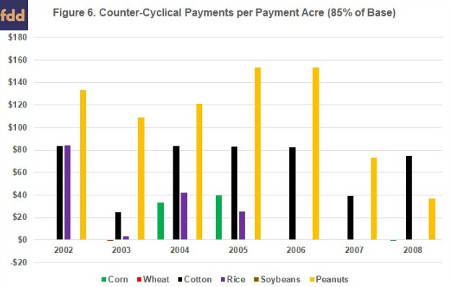
To conclude the analysis, Figure 6 compares the target price-based payments of the CCP on the basis of the average payment acres during the 2002 Farm Bill; payment acres equal 85% of the base acres for the commodity. By this measure, peanuts and cotton received the most favorable target prices. Base acres of both crops received payments each crop year and received the largest payments per payment acre.
Concluding Thoughts
As Congress undertakes farm bill reauthorization, the fixed-price policy for farm program payments remains at the forefront of the commodity policy debate (farmdoc daily, April 26, 2018). Given relatively low crop prices in recent years and projections for them to remain at these lower levels, as well as the return of cotton acres to the program, questions about this policy arguably become more pressing. A policy by which Congress fixes price triggers in the statute raises concerns due to a lack of transparency. Lacking transparency, it is difficult to measure whether the prices were fixed on a fair and equitable basis among the commodities covered by the policy. Comparing fixed prices in the last three farm bills with marketing year average prices demonstrates reason for this concern. Based on market prices, Congress provided owners of cotton and peanut base with far more favorable target prices in 2002 and continued that favorable treatment in 2008. With cotton removed in 2014, peanuts received the most favorable treatment by Congress in this version of the policy as contained in the Price Loss Coverage (PLC) program.
One question facing Congress as it undertakes reauthorization is whether it will continue this inequitable treatment in farm program policy. The House Ag Committee farm bill as reported to the full House does, however, add a market-oriented potential upside to reference prices. By comparison, Senators John Thune (R-SD) and Sherrod Brown (D-OH) have introduced a bill that would revise the ARC program but also institute a cap on reference prices that prevent them from exceeding the 10-year average MYA price (Wyant, April 26, 2018). Future articles will provide further analysis of these provisions and the impacts of fixed price policy.
Source: farmdocdaily