Tracking and analyzing data from individual animals provides useful insights into your operation
Fredrik Sandberg, PhD, vice-president of health and nutrition, Furst-McNess Company
In this series, I explored the system of “evidence-based pig production.” Last week, I focused on the topic of knowing and communicating the limits of your production capability. In this installment, we’ll look at the final hurdle: the “average pig” versus a population of pigs.
When we look at the average daily gain of a close out or the average weight of a load of pigs going to slaughter, these are all averages with no reference to the individual pigs represented by that value (the population). This level of information requires detailed research where producers track individual animals.
An exception to the focus on population-level data is slaughter records, where data can be available at the individual animal level. We may choose, for example, to use a lower level of medication or simpler rations in the nursery, and average daily gain or feed efficiency is not affected negatively on the close out. Yet, six months later, we have a much more variable group of pigs at slaughter and struggle to meet our marketing target weight.
Figure 1 shows the results of a trial where pigs were either fed two standard phases from 200 lbs (90.7 kg) to market, or were fed those same diets containing a feed ingredient called Lean Fuel®.
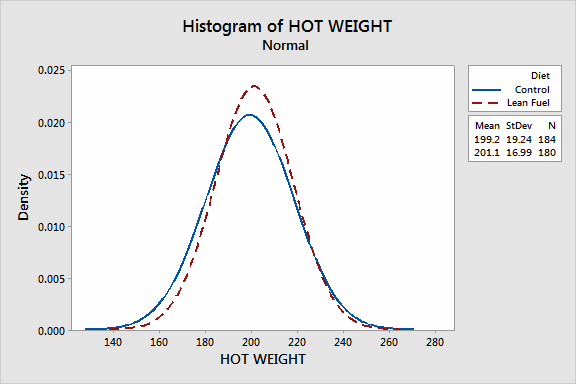
Figure 1: The carcass weight distribution of pigs fed a standard diet (control) or fed that same diet containing a feed ingredient called Lean Fuel®. (Furst-McNess Internal Research Report, 2016.)
Carcass weight was increased by 1.9 lbs (0.9 kg) by feeding Lean Fuel®, and the standard deviation was reduced greatly from 19.2 to 16.9 lbs (or 8.7 kg to 7.7 kg). The overall distribution of carcass weights shifted to the more favorable weights, together with a reduction in lighter pigs. A standard deviation of 19 lbs (8.6 kg) means that 95 per cent of the pigs will approximately be within an 80 lb (36 kg) range, and a standard deviation of 16.9 lbs (7.7 kg) means pigs fall within a range of 70 lbs (31.8 kg).
As packer matrixes have very high value areas in their grids, a reduced standard deviation can yield significant additional revenue. Without looking at overall performance TOGETHER with individual performances, we could not have identified this improvement. There are many such examples we could give. Working with your production data to monitor your ENTIRE population of individual animals as well as the averages of the whole, in light of your genetic, health and production environments, will improve your bottom line.
As a nutritionist, I have often seen one of the aforementioned factors alter animals’ response to a given feeding program because producers or stakeholders did not communicate something upfront. Without effectively communicating good quality records and data for ALL of the key components of your system that affect performance, you will not maximize the support of your stakeholders and optimize your system stability.
Dr. Fredrik Sandberg is the vice-president of health and nutrition for the Furst-McNess Company. He has primary oversight of the company’s swine feeding program, as well as its research and development program, with a heavy focus on antibiotic-free and ractopamine-free feeding programs for swine, poultry and ruminants. Sandberg completed his PhD at the University of Edinburgh in Scotland, with a focus on computational modeling of growth and nutrient requirements in swine during periods of health and disease.