By Jonathan Coppess, Gary Schnitkey, Nick Paulson
Department of Agricultural and Consumer Economics
University of Illinois
Carl Zulauf
Department of Agricultural, Environmental and Development Economics
Ohio State University
To round out the initial discussion of fixed price farm policy, this article reviews Federal expenditures for deficiency payments during the 1975 to 1995 crop years. The article builds on the comparisons using costs of production (farmdoc daily, March 8, 2018) and market prices (farmdoc daily, Feb. 22, 2018). The expenditures in this article are calculated from the Commodity Credit Corporation (CCC) history of expenditures provided by the Farm Service Agency (FSA, CCC Budget Essentials).
Background
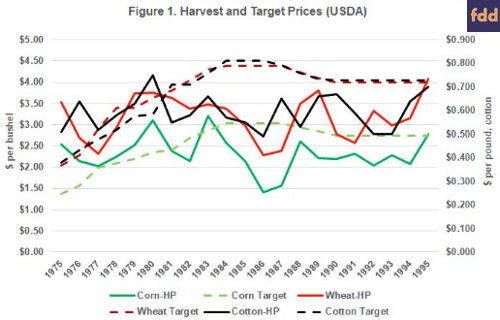
As discussed previously, the policy triggered deficiency payments when market average prices were below a price fixed in statute by Congress. Figure 1 reviews the fixed target prices in the years 1975 to 1995 with the harvest prices provided in the USDA-ERS
Commodity Costs and Returns data (USDA-ERS, Commodity Costs and Returns). The program during these years generally used an average of market prices for some portion of the marketing year to trigger deficiency payments. For example, the 1973 Farm Bill used the national average market price received by farmers in the first five months of the marketing year. Figure 1 uses the harvest prices (solid lines labeled HP) in the ERS data and not the actual prices used in the program. Thus, the relative relationships between harvest and target prices is being represented in Figure 1, not actual per unit payment rates.
One of the long-running concerns with farm support policy involved the impact Federal assistance would have on farmer planting decisions. Put simply, low prices should provide a signal from them market to farmers that less of a commodity was needed; based on that signal farmers would be expected to plant less. This rarely happened and, in fact, farmers would typically respond to lower prices by planting more to the crop in an attempt to offset the lower prices. Federal payments could make it worse by encouraging farmers to increase planting and production in a low price, over-supplied market. Incentivizing production with assistance would further depress prices and lead to larger payments in a self-feeding cycle of problems. From 1933 to 1973, Congress used production controls, largely designed as limits on the acres farmers could plant to the supported commodities, as an attempt to counter the production incentive of the assistance.
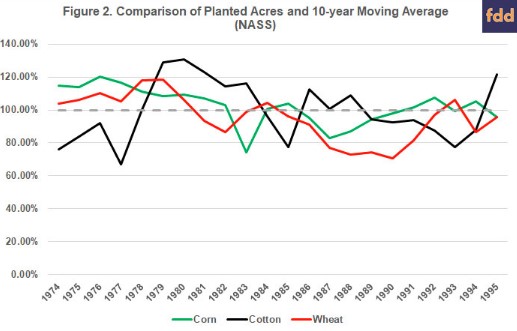
The target price program created in 1973 was a complete reversal of this forty-year policy; Congressionally-fixed prices were intended to encourage farmers to expand production, in part to capture export markets. Target prices during this era were coupled to production decisions. Figure 2 provides one perspective on the question of whether the target prices of the era impacted planting decisions. Figure 2 compares the planted acres to corn, cotton and wheat (NASS Quick Stats) to the moving average of planted acres for the previous ten years as a percentage (planted acres divided by ten-year moving average of planted acres). The dashed line is 100% and would indicate planted acres at the ten-year average; above the line would indicate increases in planted acres as compared to the ten-year average. It is also important to note that during these years, USDA often required set-aside acres and a few years used payment-in-kind (PIK) programs to get farmers to reduce planted acres; the most notable usage of PIK is in 1983 for corn.
Discussion
When market average prices in a year were below the target prices, the farmer received a deficiency payment on the difference. That payment was calculated using an historic program yield and the program acres for the crop; a figure typically coupled to what the farmer had recently planted to the crop. In general, the larger the spread between market prices and target prices, the higher the payment for the crop. Figure 1 above estimates that spread using harvest prices from the ERS data. Figure 2 indicates increased planting acres relative to the average of the previous 10 years in the Seventies and early Eighties.
Figure 3 adds to the review by comparing the total deficiency payments for corn, cotton and wheat for the crop year as reported by the CCC. As the crops with the most planted acres and acres in the program, corn and wheat received the most in total deficiency payments in each year CCC reported them.
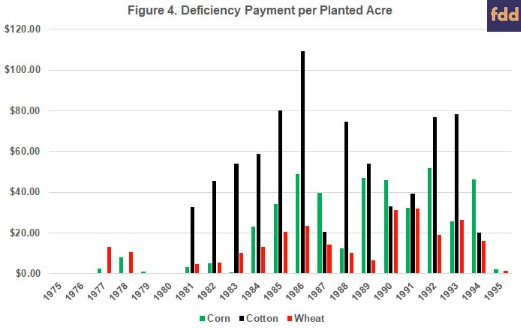
Figure 4 illustrates estimated deficiency payments per planted acre. It divides the total payments per crop in Figure 3 (CCC) by the total planted acres for the crop year used in Figure 2 (NASS Quick Stats). While corn and wheat received the most total deficiency payments each year, cotton received the most in deficiency payments per planted acre in most years.
Deficiency payments provided income-based support. To complete the comparisons of the fixed-price policy in this era (1975 to 1995), Figures 5 through 8 review deficiency payments for each of corn, cotton and wheat in relation to the gross value of production and costs of production data for each crop year (ERS, Total Economic Costs). ERS provides data on the gross value of production as an estimate of crop income. ERS calculates gross value of production using the average price at harvest and the national average yield. ERS provides both gross value of production and total economic cost of production per planted acre but does not account for set aside acres in its calculations either. The following discussion also does not adjust the ERS data for set-aside acres, using the per-planted-acre figures provided by ERS
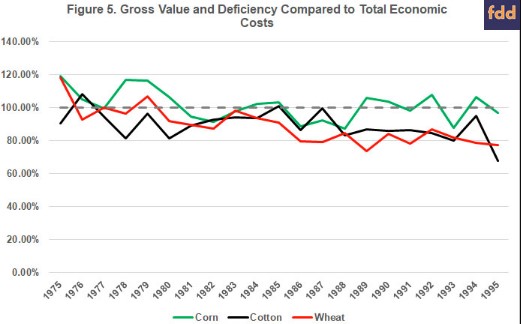
First, Figure 5 adds the gross value of production and the deficiency payment for each year to get an income estimate for each crop. That estimate is divided by the total economic costs of production to get the percentage of income to costs. The dashed line is 100% and points above it indicate years of estimated profits (income above costs) and years below it would be those estimated to produce a loss on the crop.
Figure 6 looks specifically at corn. The bars illustrate gross value of production and any deficiency payment per planted acre each year. The line illustrates total economic costs of production per planted acre for each year. Those years where the bars are above the line would be years estimated to have produced a profit; where the line is above the bars, ERS estimated a loss on the corn crop.
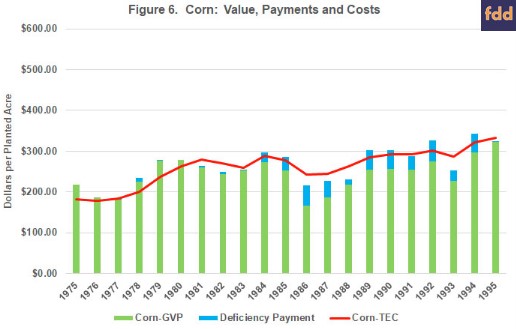
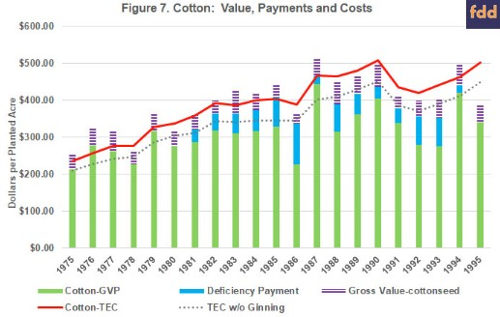
Figure 7 provides a similar review for cotton but contains additional information due to two unique aspects of the cotton data. First, ERS provides a gross value of production for both cotton lint and cottonseed; the latter is represented by the purple. Cotton's income estimates thus include gross value of production for cotton lint and for cotton seed, as well as the deficiency payments if reported for that crop year. Second, the cotton data includes ginning costs which is a significant cost item that is unique to cotton. The solid red line again illustrates the total economic cost of production reported by ERS and the dashed gray line represents total economic costs of production minus ginning costs.
Finally, Figure 8 reviews the wheat data. Similar to corn, wheat's gross value of production and deficiency payment are in the stacked bars with total economic costs of production represented by the red line. This information indicates very few years of estimated profits for wheat during this era, even with the deficiency payments included.
Concluding Thoughts
Fixed-price commodity policy has long occupied a primary position in farm bill debates and with a return to relatively low crop prices it will continue to do so. In reviewing it for the pending farm bill debate, this series has attempted to compare the policy in its earlier iterations for the three major commodities. Underlying this review are basic concerns with the policy, including that the setting of prices in statute by Congress lacks transparency about how those prices are fixed. With a lack of transparency come concerns about the fairness of the policy across commodities and whether farmers are being treated equitably. From these are further concerns about the impact on farmers and taxpayers, as well as the potential impacts on the markets and farm economy.
Created in 1973 and continued through the 1990 Farm Bill, whether target prices were fixed by Congress on a fair and equitable basis as among the commodities is a difficult question to answer due in large part to the lack of transparency for the prices fixed. Much also depends on the measure used for making the comparison. For example, they do not appear to have been fixed equitably in terms of the average marketing year average prices from the ten years prior (farmdoc daily, Feb. 22, 2018, Table 1). Compared in terms of total economic costs of production, the initial target prices may have been on a much more equitable footing at around 65% to 69% in 1975 (farmdoc daily, March 8, 2018, chart 6). Total economic costs of production, however, raise concerns and questions about how the costs of production are calculated and whether they can provide an equitable comparison for policy when the crops use different costs in the calculation. This article adds to the discussion a comparison based on what the CCC paid to farmers under the policy during these years, including in terms of gross value of production and total economic costs.
Target price policy was eliminated by the 1996 Farm Bill and recreated as the counter-cyclical program by Congress with the 2002 Farm Bill. Subsequent analysis will measure and compare target prices in the recent farm bills; a further comparison to the historical measures in these three articles will add further perspective on this policy. A key matter underlying these discussions is the reality that the policy decisions made by Congress, such as the levels for fixed prices, determine whether assistance is triggered and how much assistance farmers receive; questions of transparency, fairness and equitable treatment have real-world implications among those impacted by the policies.