By
Michael Langemeier
Center for Commercial Agriculture
Purdue University,
Allen Featherstone
Department of Agricultural Economics
Kansas State University
Liquidity measures help gauge whether a farm or group of farms has the ability to meet short-term debt obligations. In addition to examining average liquidity values over time, most analysts want to know how many farms fall below specific liquidity thresholds. This article examines differences in liquidity among Kansas Farm Management Association (KFMA) farms with continuous data from 1998 to 2017. There were 190 KFMA farms with continuous data for the 20-year period. Farm types represented in this sample of farms include crop farms, crop/beef farms, and beef farms.
Estimating and Analyzing Liquidity
Commonly used liquidity measures include working capital to gross income, working capital per acre, and the current ratio. Working capital is measured by subtracting current liabilities from current assets. Current assets include cash, accounts receivable, supply inventories, crop inventories, and market livestock inventories. Current liabilities include accounts payable, operating lines of credit, and the portion of non-current loans due within the next year. The current ratio is computed by dividing current assets by current liabilities. The working capital to gross income measure can also be computed using gross revenue, value of farm production, or total expenses. Value of farm production is considered a more appropriate measure of gross income when the sample of farms includes both crop and livestock farms. This article uses working capital to value of farm production and the current ratio to measure liquidity.
Liquidity thresholds are typically used by analysts to determine whether a farm has an adequate liquidity position. The two thresholds examined for the working capital to value of farm production were 0.20 and 0.35. The second threshold (0.35) is a commonly used threshold by financial analysts and would be considered an adequate level of working capital to weather a one or two year downturn. The first threshold (i.e., 0.20) depicts a situation where a farm may have trouble repaying loans. As with the working capital to value of farm production threshold of 0.35, a current ratio above 2.0 is considered adequate. A farm with a current ratio below 1.0 is not able to cover their current liabilities by selling all of their current assets, and therefore may have trouble repaying loans.
Trends in Liquidity Measures
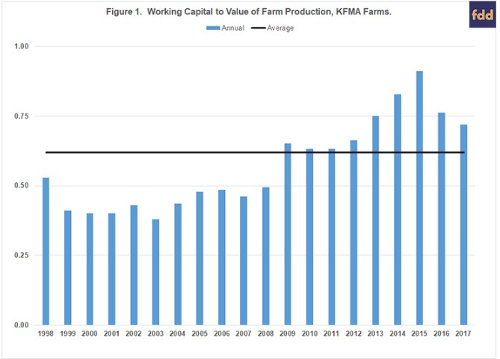
Figure 1 illustrates the annual averages for working capital to value of farm production for the sample of KFMA farms. Working capital reached a peak of $489,304 in 2014. Since then average working capital has declined to an average level of $372,812 in 2017. Working capital to value of farm production averaged 0.62 over the 20-year period. The working capital to value of farm production measure was above the average for each year from 2009 to 2017.
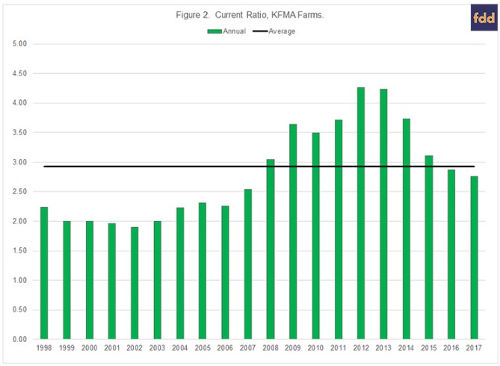
Trends in the average current ratio for the sample of KFMA farms are depicted in Figure 2. The average current ratio during the 20-year period was 2.92. The current ratio was above the average ratio from 2008 to 2015. The current ratio peaked in 2012 at 4.26, and dropped to 2.76 in 2017. Though relatively lower in 2017 compared to its peak value, the current ratio in 2017 was still higher than the averages experienced prior to 2008.
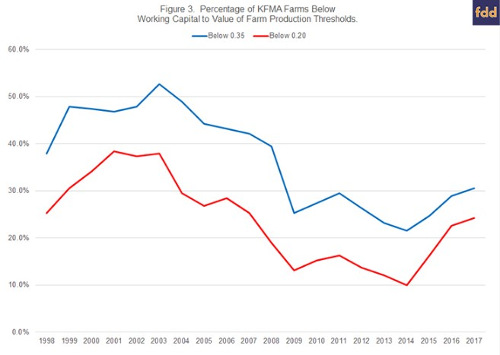
As noted in the introduction, most analysts are interested in how liquidity measures vary among farms. To examine liquidity differences among farms, we identified the percentage of farms below the two thresholds for working capital to value of farm production. The two thresholds examined were 0.20 and 0.35. Figure 3 illustrates the trends in these two thresholds over the 20-year period. On average, over the 20-year period, the percentages of farms with a working capital to value of farm production below 0.20 and 0.35 were 23.8% and 36.8%, respectively. The 2017 percentages were 24.2% below the 0.20 threshold and 30.5% below the 0.35 threshold. The percentage of farms below the two thresholds increased substantially in 2015, 2016, and 2017. However, the 2017 threshold percentages were still smaller than they were prior to 2008.
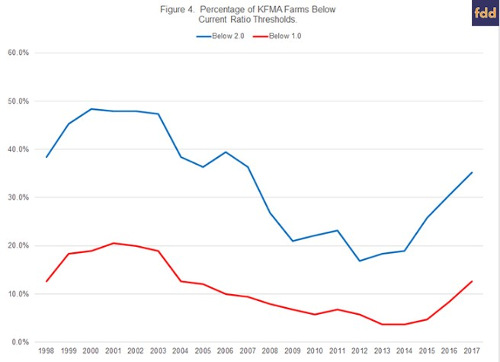
The two thresholds examined for the current ratio were 1.0 and 2.0. The trends in these two thresholds are illustrated in Figure 4. On average, over the 20-year period, the percentages of farms with a current ratio below 1.0 and 2.0 were 11.0% and 33.2%, respectively. It is important to note that farms with a current ratio below 1.0 are in a difficult situation. To repay debt, these farms would need to increase value of farm production, reduce expenses, refinance intermediate or long-term debt, sell intermediate or long-term assets, or infuse capital from off-the-farm to ensure that the current debt obligations are repaid. The percentage of farms with a ratio below 1.0 (below 2.0) was above average from 1998 to 2005 (1998 to 2007) and below average from 2006 to 2016 (2008 to 2016). The percentage of farms in 2017 with a current ratio below 1.0 and 2.0 was 12.6% and 35.3%, respectively. The percentage of farms below the two thresholds has increased dramatically during the last couple of years. The improvement in the current ratio experienced as a result of the large increase in ethanol production in 2007 has essentially disappeared. Similar results were noted for Illinois FBFM farms by Zwilling et al. (farmdoc daily, July 20 2018).
Concluding Comments
This article examined trends in liquidity for a sample of KFMA farms. Liquidity, measured using the current ratio, has declined substantially since its peak in 2012. The percentage of farms with a current ratio below 1.0 and 2.0 was 12.6% and 35.3% in 2017. In contrast, these percentages were only 5.8% and 16.8% in 2012. This suggests that farms are finding it increasingly difficult to repay loans in a timely fashion. Though not illustrated in this article, correlation coefficients between the liquidity measures and farm characteristics were also computed. Liquidity was positively related to the debt to asset ratio and the asset turnover ratio, and negatively related to percentage of acres owned. The highest absolute value for the correlation coefficients between liquidity and the farm characteristics was for the relationship between liquidity and the debt to asset ratio. Farms with more leverage had lower levels of liquidity.
Liquidity measures in 2018 will depend on a multitude of factors including crop prices and yields, weather, and other factors, all of which are inter-related. Using current futures prices adjusted for basis, trend yields, and expected government payments; we expect the percentage of farms below the critical liquidity thresholds to increase in 2018.
Source: farmdocdaily