By Carl Zulauf
Department of Agricultural, Environmental and Development Economics
Ohio State University
Jonathan Coppess, Gary Schnitkey, Nick Paulson
Department of Agricultural and Consumer Economics
University of Illinois
Cost of Federal Crop Insurance is an on-going farm policy issue. In his Fiscal Year 2019 budget, President Trump proposed a 14 percentage point reduction in the insurance program subsidy. A farmdoc daily article of
March 15, 2018 estimated that the proposed 14 percentage point reduction is associated with a 17 percentage point decline in share of planted acres insured for barley, corn, cotton, oats, peanuts, rice, sorghum, soybeans, and wheat as a group. The estimated decline potentially conflicts with a long standing goal for crop insurance to insure a large share of acres in order to reduce the demand for ad hoc disaster assistance. This article continues the analysis by examining whether the relationship between share of acres insured and premium subsidy share varies by crop. Such a variation is found, implying additional policy issues.
Historical Trends in Premium Subsidy Share and Insured Acre Share by Crop
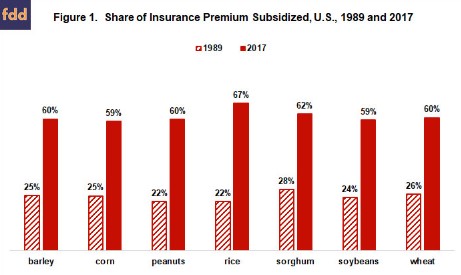
In 1989, the first year electronic data are available from the Risk Management Agency; the premium subsidy share varied from 22% (peanuts, rice) to 28% (sorghum) (see Figure 1 and data note 1). In 2017, the range was from 59% (corn, soybeans) to 67% (rice). Excluding rice, 62% (sorghum) was the high. A narrow range was expected because for the crops in this study the subsidy share is the same for a given insurance product and coverage level. The different premium subsidy shares by crop thus arise because producers of a given crop elect different products and coverage levels.
Share of planted acres that are insured has grown substantially. A high share in 1989 of 59% (peanuts) compares with a low share in 2017 of 79% (barley) (see Figure 2). The share of insured acres varied more in 1989, with a range of 16% (rice) to 59% (peanuts) in 1989 vs. 79% (barley) to 91% (peanuts) in 2017. The increases in insured acre share and premium subsidy share that occurred from 1989 to 2017 differed markedly across the crops (see Figure 3). The range was from a -6 percentage point difference (peanuts, 31% - 37%) to a +21 percentage point difference (sorghum, 55% - 34%).
Relationship between Insured Acres and Premium Subsidy
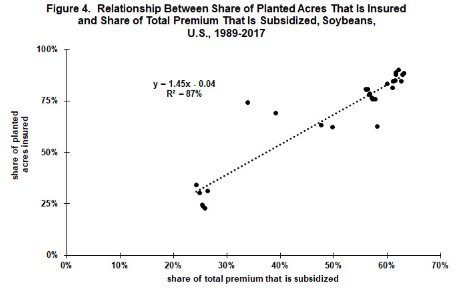
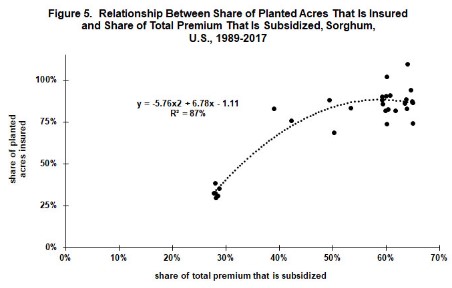
The different changes across crops in insured acre share for relatively similar changes in premium subsidy share suggests the relationship between these 2 variables is likely to vary by crop. Regression analysis confirms this suggestion. Figures 4 and 5 present the scatter graph of insured acre share vs. premium subsidy share for soybeans and sorghum. Explanatory power of the regression equation estimated for the 2 crops is the same (R2 = 87%), but the best fit is a linear equation for soybeans vs. a nonlinear equation for sorghum. Like soybeans, the best fit for corn is linear while, like sorghum, the best fit for barley, peanuts, rice, and wheat is nonlinear (see Appendix Figures 1-3). A nonlinear best fit implies that, as the premium subsidy share increased, percentage point increase in insured acre share became smaller. A linear best fit implies no such diminishing response, at least over the 1989-2017 period.
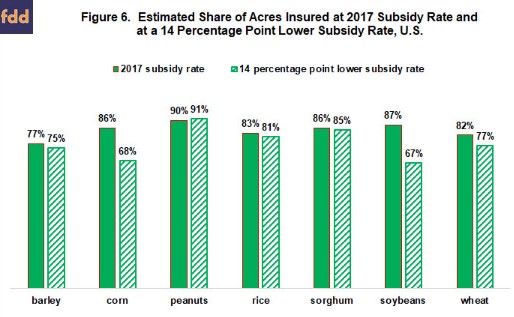
Implication of the 2 different relationships is illustrated by using the regression equations to compare estimated share of acres insured at the subsidy share observed for 2017 vs. estimated share if the subsidy share is reduced 14 percentage points, as President Trump has proposed. Share of acres insured for corn and soybeans is estimated to decline by 18 (86%-68%) and 20 (87% - 67%) percentage points, respectively see Figure 6. In contrast, the decline is minimal (less than 2 percentage points) for barley, peanuts, rice, and sorghum (see data note 2). The largest decline among crops with a nonlinear best fit is wheat at 5 percentage points (82% - 77%).
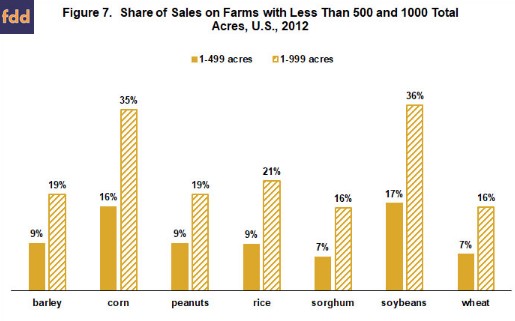
The starkly different findings for corn and soybean insured acres prompts the "why" question. One potential explanation is that a larger share of corn and soybean acres are on smaller farms. Share of corn and soybeans on farms of less than 500 total acres is approximately twice the share of the other crops (16% vs. 8%) (see Figure 7). The same is true for farms of less than 1000 total acres (36% vs. 18%). Nonfarm income is a larger source of income on smaller farms. The 2012 Census of Agriculture reports that farm income is 25% or more of household income for only 22% of farms with less than 500 total acres vs. 75% for farms with over 1000 total acres. The diversification provided by nonfarm income reduces the need for crop insurance and thus likely increases the responsiveness of smaller farms to changes in the premium subsidy. Knight and Coble reported that a positive relationship between farm size and purchase of crop insurance was one of the key findings of the crop insurance research literature between 1980 and the mid-1990s.
Summary Observations
- As with the analysis in the March 15, 2018 farmdoc daily article, this analysis is simple and needs verification using more sophisticated procedures. This article focused on the impact of lower premium subsidy shares on the purchase of crop insurance. Lower subsidy shares may also result in farms electing lower coverage levels.
- Given the preceding caveat, this analysis finds support for the argument that reducing the federal subsidy rate for crop insurance is likely to have differential impacts across crops.
- The analysis suggests that the share of acres insured is likely to be impacted more for corn and soybeans than for the other 5 crops examined in this study.
- The greater share of corn and soybean acres on smaller farms is proposed as a possible explanation for the higher response of corn and soybeans to a cut in the subsidy. Smaller farms earn a larger share of income from nonfarm sources and thus may be more sensitive to changes in the insurance subsidy. Nonfarm income can substitute for crop insurance as a risk management strategy.
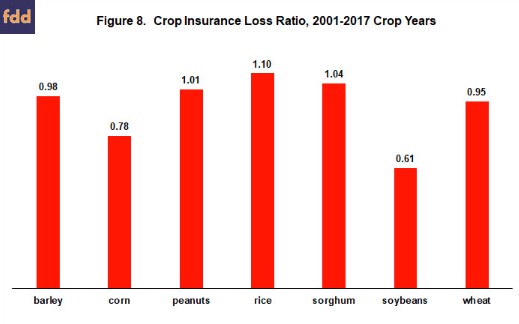
- The Agricultural Risk Protection Act of 2000 authorized a major increase in the premium subsidy rate. Since 2001, soybeans has had a loss ratio that is less than 1.0 at the 99% level of statistical confidence (see Figure 8). No other crop in this study has a loss ratio that differs from 1.0 even with 90% statistical confidence. The 2008 farm bill established 1.0 as the target loss ratio for the crop insurance program as a whole.
- A disproportionate loss of insured soybean acres would likely lead to higher premiums for other crops.
- The March 15, 2018 farmdoc daily article proposed that, should the political market place decide to reduce the insurance subsidy share, then a slow, measured research informed approach would allow untoward consequences to be minimized. Differential impact by crops in the presence of differential loss ratios by crops increases the likelihood of untoward consequences, reinforcing the need for a slow, measured research informed approach.
Data Notes
1) Cotton is not included in this study because of the potential influence of the STAX county cotton insurance contract authorized by the 2014 farm bill. At 80%, its subsidy share is higher than any other county insurance product. Oats is not included since a large share of acres planted to oats is not harvested but planted as a cover crop. Insurance data used in this article are from the U.S. Department of Agriculture (USDA), Risk Management Agency while planted acre data are from QuickStats (USDA, National Agricultural Statistical Service).
2) Estimated insured acre share is higher for peanuts for the 14 point reduction than for the 2017 subsidy rate: 92% vs. 91%. A decline is more likely. The estimated increase could be the result of several factors, including data measurement errors and a relatively small number of observations. The closeness of the 2 estimates suggest the decline will likely be small.